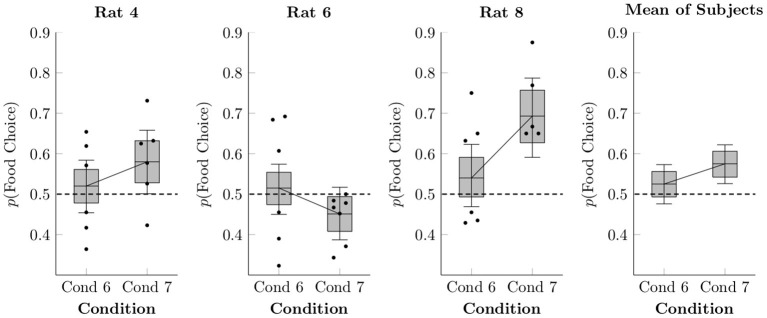
Figure 5.
Estimated proportion of food choices made for each of the rats in Conditions 6 and 7 based on a multi-level logistic regression, as well as observed proportions. The proportion of social choices was complementary to the food choices, such that p(Social Choice) = 1−p(Food Choice). Points represent observed means for each session, whereas boxes represent the 80% credible interval and whiskers represent the 95% credible interval of the estimated proportion.

