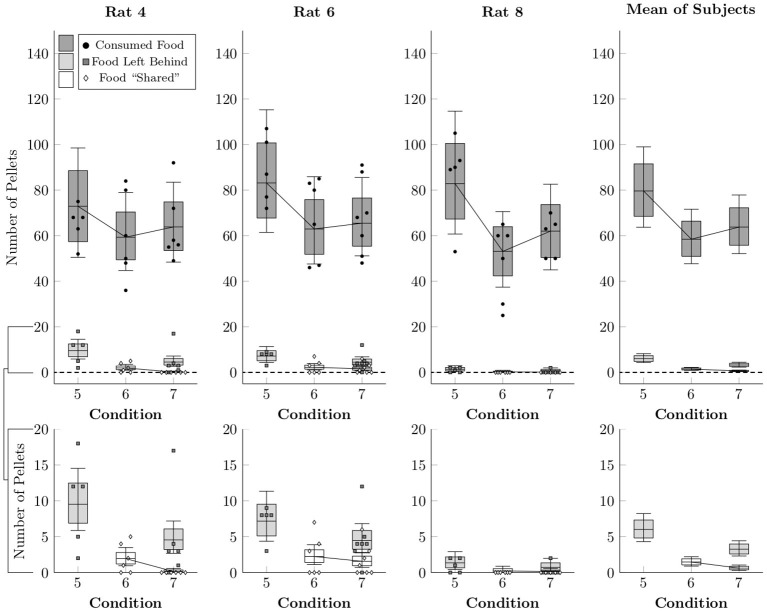
Figure 7.
Estimated number of pellets consumed by the focal rat (black circles), shared with the restrained rat (white diamonds), or left unconsumed by either rat (gray squares) in Conditions 5–7, as well as the mean of the subject estimates, based on a multi-level negative binomial regression. Points represent number of pellets in each category per session, whereas boxes represent the 80% credible interval and whiskers represent the 95% credible interval of the estimated rate.

