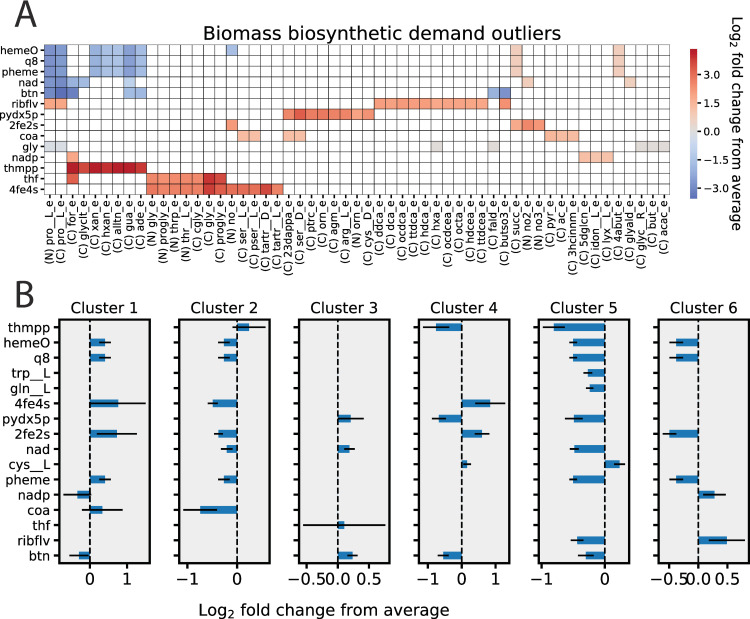
Fig 5. Characterization of aerobic condition-dependent biomass compositions.
A). Outlier analysis was performed to find growth conditions with z-scored biomass constituent synthesis demands with absolute values greater than 3. The colors on the heatmap denote the log2 fold change of the outlier compared to the average biosynthetic demand of all aerobic growth conditions. B) Hierarchical clustering using Ward’s linkage was performed to divide the in silico growth conditions into 6 clusters based on their predicted biomass demands. All 6 clusters contained multiple biomass demand values that were statistically different (p < 1x10⁻⁵ by Wilcoxon rank-sum test and log2 fold change >0.15) compared to the non-cluster demands. The significant log2 fold changes are shown comparing growth conditions in each cluster compared to the average for growth conditions not in the cluster. Error bars represent the standard deviation of the log2 fold change values.

