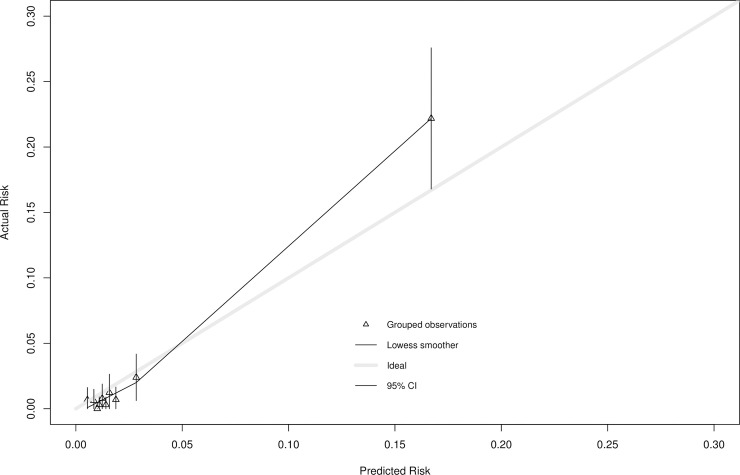
Fig 2. Calibration plot of predicted versus observed risk for the QUIDS model validation in the prospective cohort data.
Calibration plot with predicted versus actual risk the QUIDS logistic regression model as applied to the prospective cohort study data (after multiple imputation; multiple imputation set 1 used to generate plot after recalibration with updated intercept). Data relating to grouped observations are shown in Table O in S1 Text. CI, confidence interval.

