
Figure 4. Anti-ApoE ASO treatment decreases tau pathology in the 9 month old P301S/ApoE4 mice.
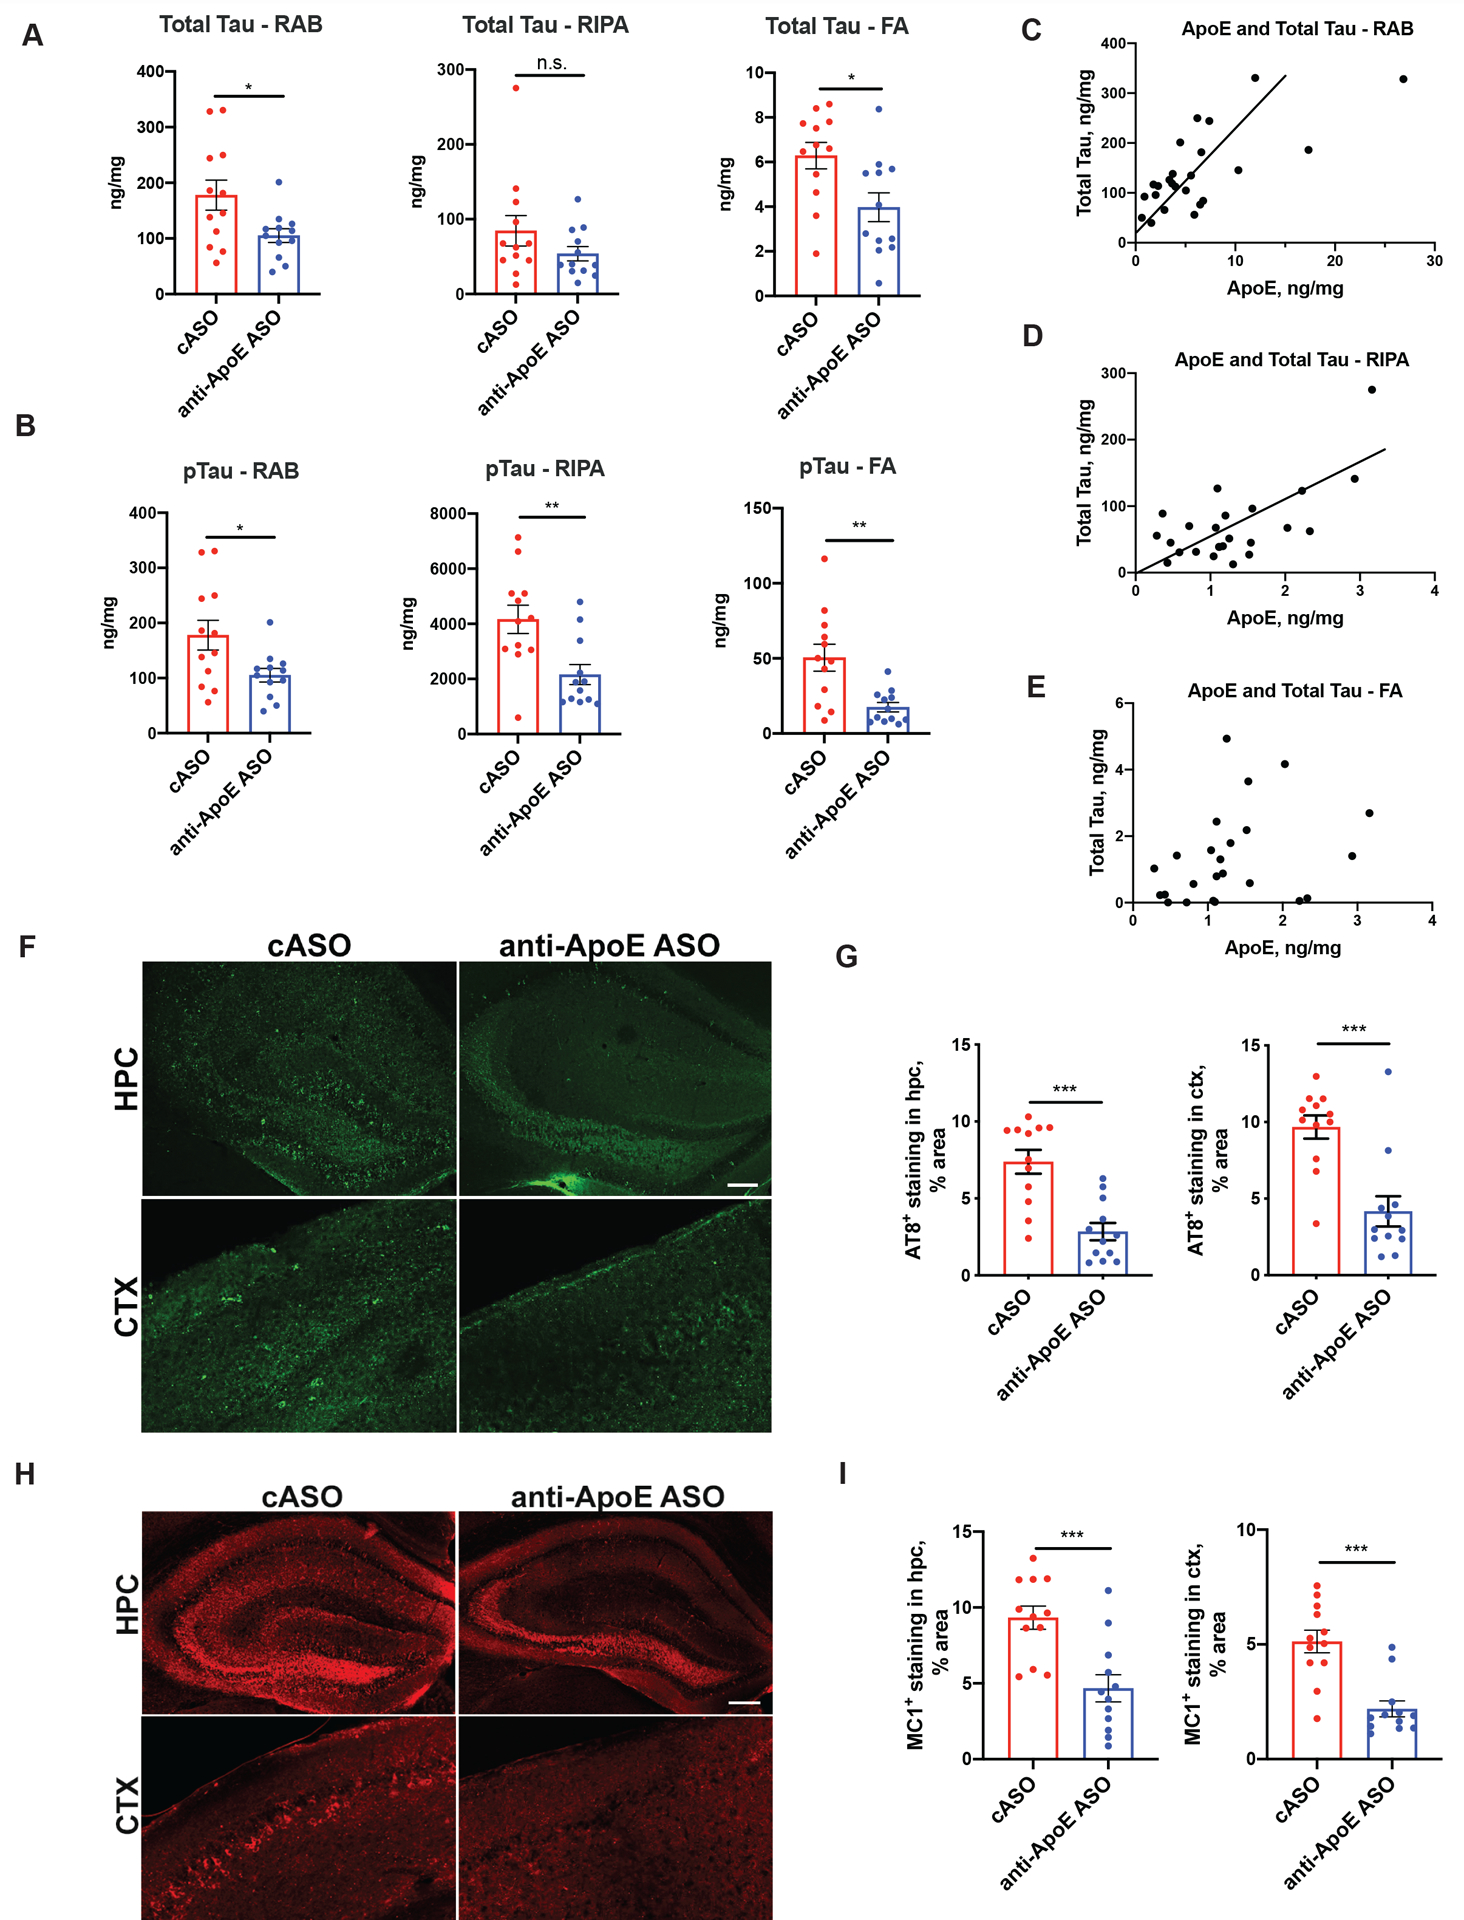
(A) Total tau levels in the hippocampus of 9 months old control and ASO-treated P301S/ApoE4 mice measured by ELISA of RAB, RIPA and 70% Formic acid (FA) fractions. N=12/group. Student`s t-test. N.S. – non-significant; *p<0.05. (B) Human phospho-tau Thr181/Ser202/Thr205 levels in the hippocampus of 9-month-old cASO and anti-ApoE ASO-treated P301S/ApoE4 mice measured by ELISA of RAB, RIPA and 70% Formic acid (FA) fractions. N=12/group. Student`s t-test. **p<0.01. (C) Correlation between human ApoE protein and total tau levels in the RAB fraction from hippocampal lysates. Pearson`s correlation for N=24 independent animals, R2=0.5004, p<0.0001. (D Correlation between human ApoE protein and total tau levels in the RIPA fraction from hippocampal lysates. Pearson`s correlation for N=24 independent animals, R2=0.4419, p=0.0004. (E) Correlation between human ApoE protein and total tau levels in the FA fraction from hippocampal lysates. Pearson`s correlation for N=24 independent animals, R2=0.09655, p=0.1394. (C-D) Representative AT8 immunostaining (C) in hippocampus of 9-month-old cASO and anti-ApoE ASO-treated mice with quantification of area covered by AT8 staining in hippocampus and cortex in (D). Scale bar: 100um. N=12/group. Student`s t-test. ***p<0.001. (E-F) Representative MC1 immunostaining (E) in hippocampus of 9-month-old cASO and anti-ApoE ASO-treated mice and quantification of area covered by MC1 staining in hippocampus and cortex in (F). Scale bar: 100 μm. N=12/group. Student`s t-test. ***p<0.001. All data is represented as mean ± SEM.