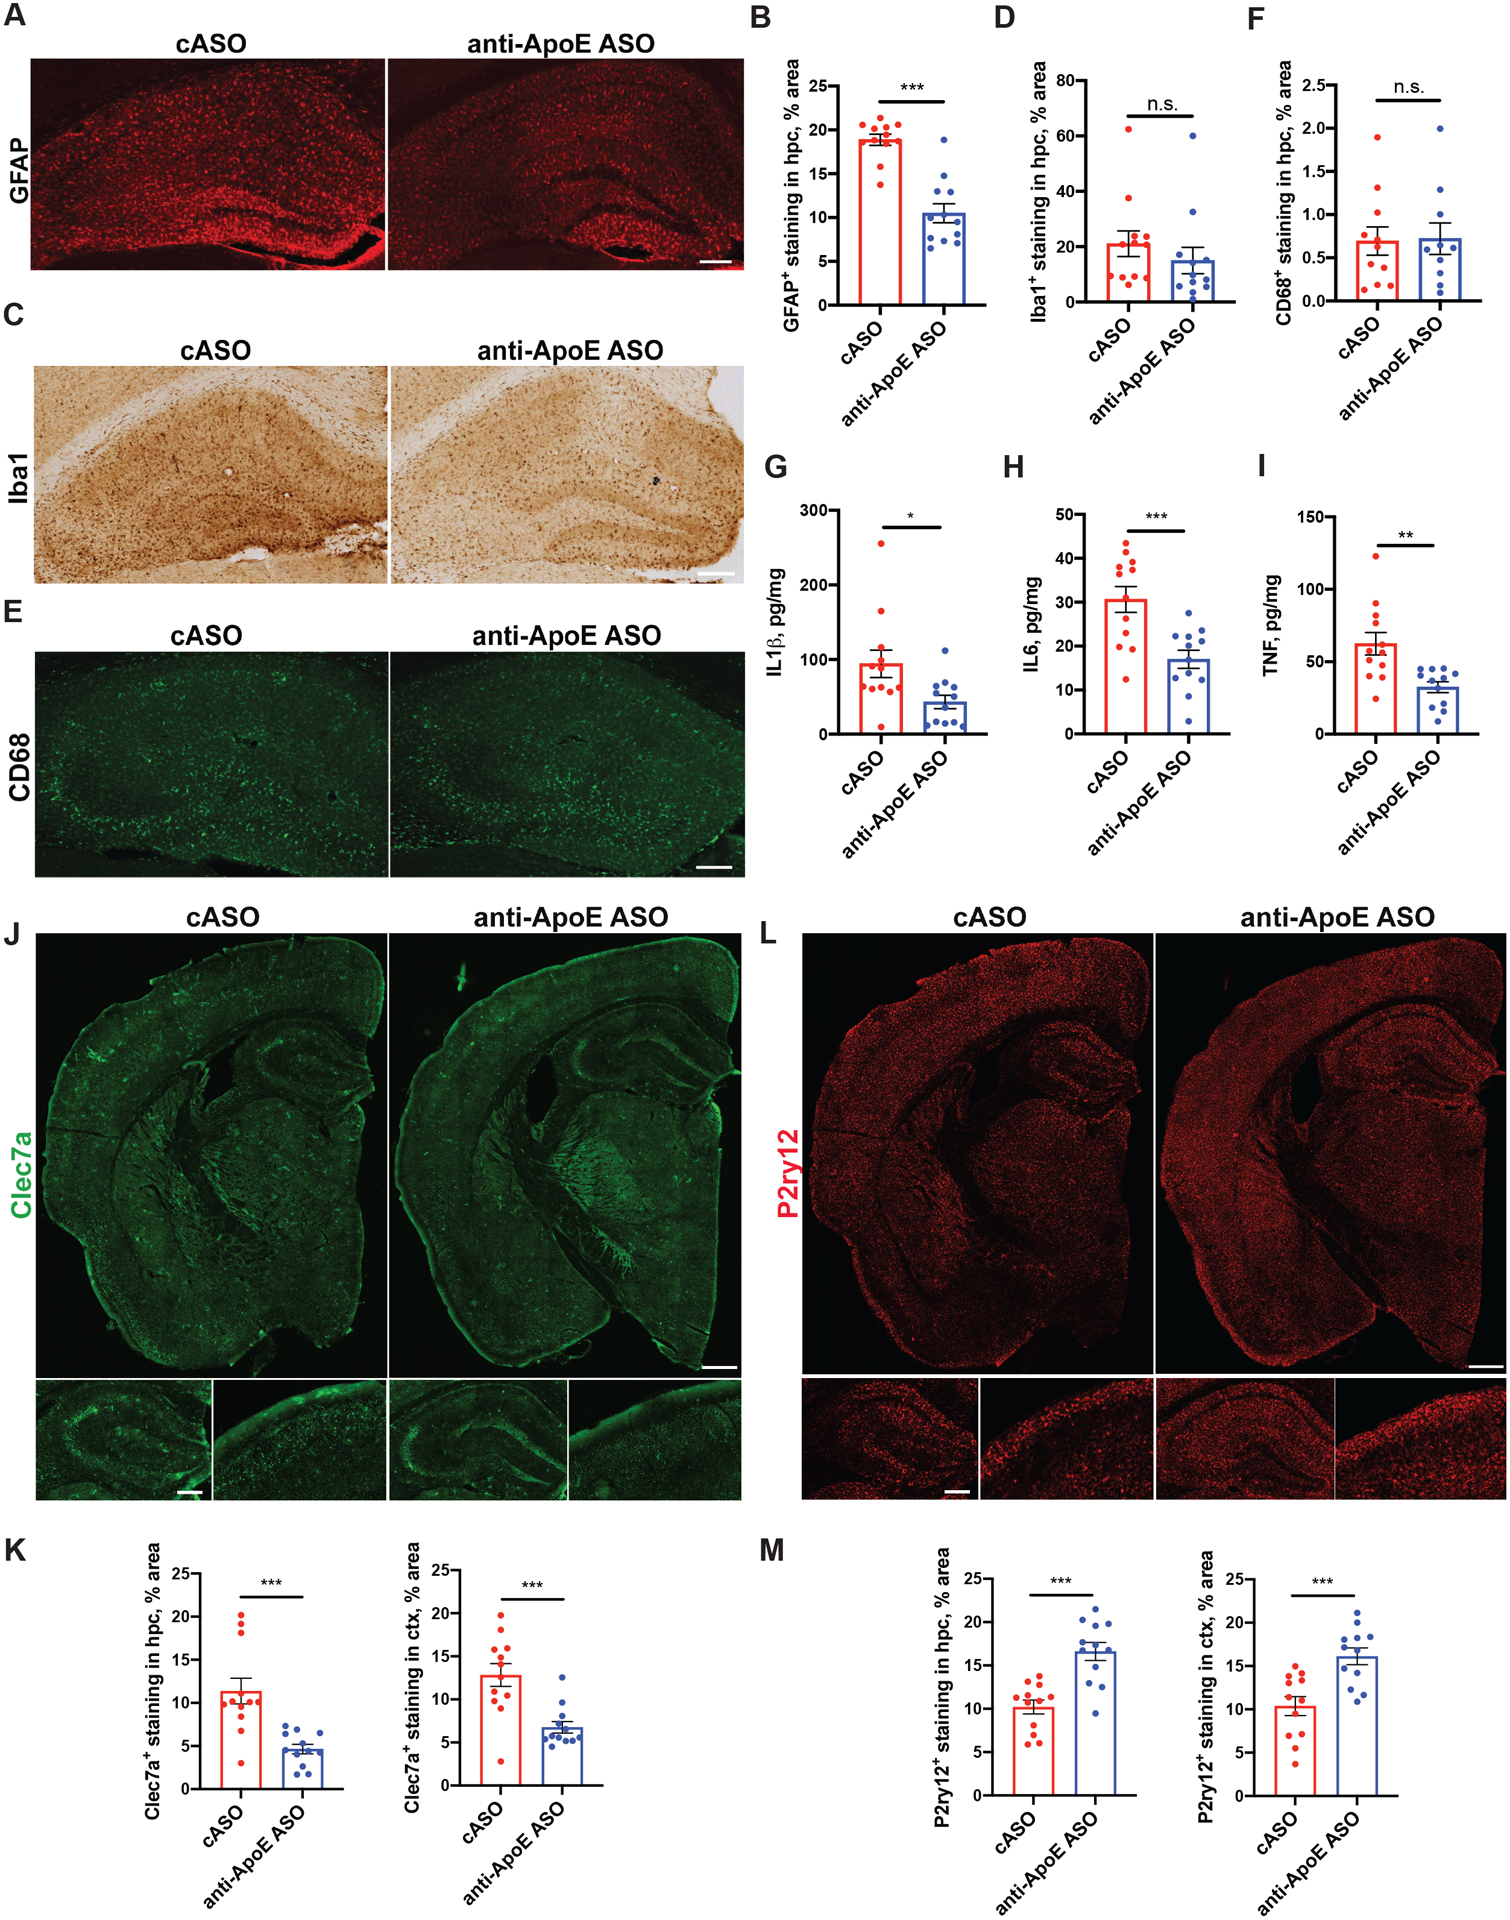
Figure 5. ASO treatment modulates aspects of neuroinflammation in 9 months old P301S/ApoE4 mice.

(A-B) Representative GFAP immunofluorescence staining (A) and quantification of area covered by GFAP staining (B) in hippocampus of 9-month-old cASO and anti-ApoE ASO-treated mice. Scale bar: 100 μm. N=12/group. Student`s t-test. ***p<0.001. (C-D) Representative Iba1 immunofluorescence staining (C) and quantification of area covered by Iba-1 staining (D) in hippocampus of 9-month-old cASO and anti-ApoE ASO-treated mice. Scale bar: 100 μm. N=12/group. Student`s t-test. N.S. – non-significant (E-F) Representative CD68 immunofluorescence staining (E) and quantification of area covered by CD68 staining (F) in hippocampus of 9-month-old cASO and anti-ApoE ASO-treated mice. Scale bar: 50 μm. N=12/group. Student`s t-test. N.S. – non-significant. (G-I) Levels of IL1β (G), IL6 (H) and TNFα (I) in hippocampus as measured by ELISA, N=12/group. Student`s t-test. *p<0.05; **p<0.01; ***p<0.001. (J-K) Representative Clec7a immunostaining (J) in brain sections of cASO-treated and anti-ApoE ASO-treated mice and quantification of area covered by Clec7a staining in hippocampus and cortex (K). Scale bar (J-top): 0.5 mm. Scale bar (J-bottom): 100 μm. N=12/group. Student`s t-test. ***p<0.001. (L-M) Representative P2ry12 immunostaining (L) in brain sections of cASO-treated and anti-ApoE ASO-treated mice and quantification of area covered by P2ry12 staining in hippocampus and cortex (M). Scale bar (L-top): 0.5 mm. Scale bar (L-bottom): 100 μm. N=12/group. Student`s t-test. ***p<0.001. All data represented as mean ± SEM.
