Figure 9.
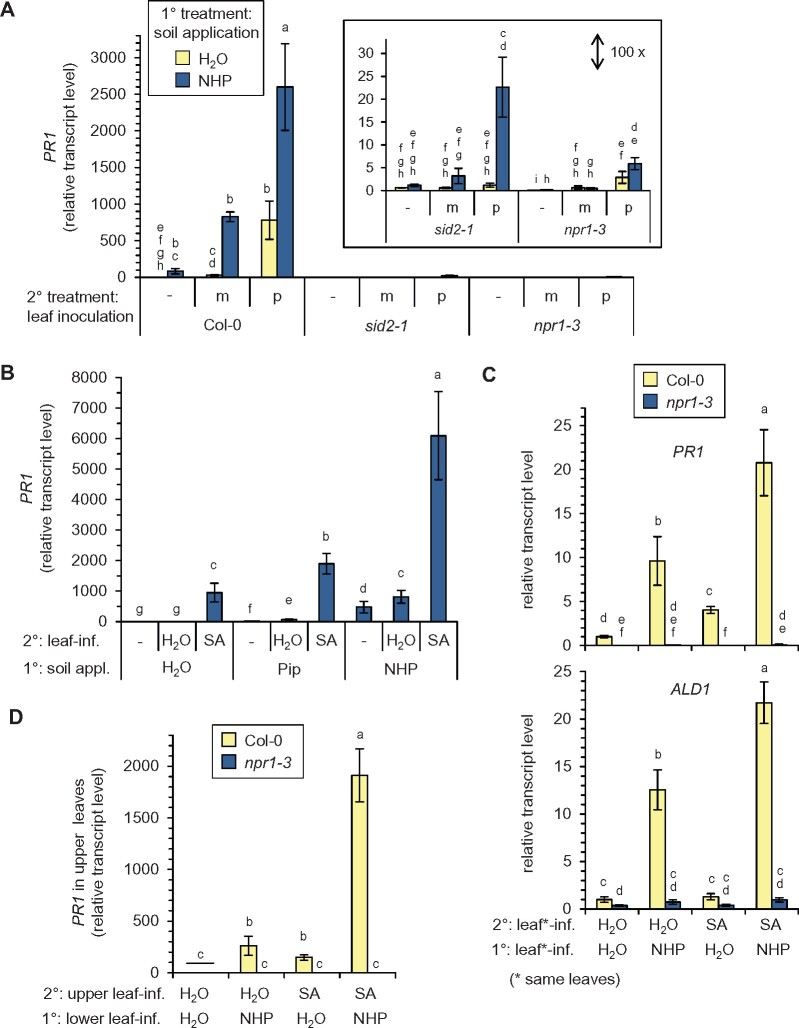
NHP and SA positively interact for the local and systemic induction of SAR-related gene expression. A, The NHP-induced priming of pathogen-triggered PR1 expression is strongly dependent on SA biosynthesis and requires NPR1. Col-0, sid2-1, or npr1-3 plants were supplied with 10 mL of 1 mM NHP or 10 mL of H2O via the soil (1° treatment), and leaves challenge-inoculated with Psm (p) or mock-infiltrated (m) with 10 mM MgCl2 1 d later (2° treatment). The leaves of a third set of plants were left untreated (−). The transcript levels of PR1 in the leaves were determined 12 h after the 2° treatment by RT-qPCR analysis (n = 4). Transcript values are given relative to the mean value of the Col-0 control samples (1° treatment H2O/no 2° treatment). B, NHP supplied via the soil primes the foliage for enhanced SA-induced PR1 gene expression. Col-0 plants were 1°-treated with 1 mM NHP, 1 mM Pip, or H2O (10 mL each) via the soil. One day later, three leaves were infiltrated with a 0.5 mM SA solution or with H2O (2° treatment). The leaves of a third set of plants were left untreated (−). Leaf PR1 transcript levels were determined 4 h after the 2° treatment (n = 4) and are given relative to the mean of the 1°-H2O- and 2°-H2O-treated samples. C, Leaves treated with exogenous NHP are primed for enhanced SA-inducible PR1 and ALD1 expression. Three leaves of Col-0 or npr1-3 plants were infiltrated with 1 mM NHP (or H2O; 1° treatment) and the same leaves infiltrated one day later with 0.5 mM SA (or H2O; 2° treatment). Leaf PR1 (top) and ALD1 (bottom) transcript levels were determined 4 h after the 2° treatment (n = 4) and are given relative to the mean of the 1°-H2O- and 2°-H2O-treated samples. D, A local leaf application with NHP primes distant leaves for enhanced SA-induced PR1 expression. Three lower rosette leaves of Col-0 or npr1-3 plants were infiltrated with 1 mM NHP (or H2O; 1° treatment) and three upper leaves infiltrated one day later with 0.5 mM SA (or H2O; 2° treatment). Leaf PR1 transcript levels were determined 4 h after the 2° treatment (n = 4) and are given relative to the mean of the 1°-H2O- and 2°-H2O-treated samples. Different letters denote significant differences (P < 0.05, Kruskal–Wallis H test).

