Figure 3.
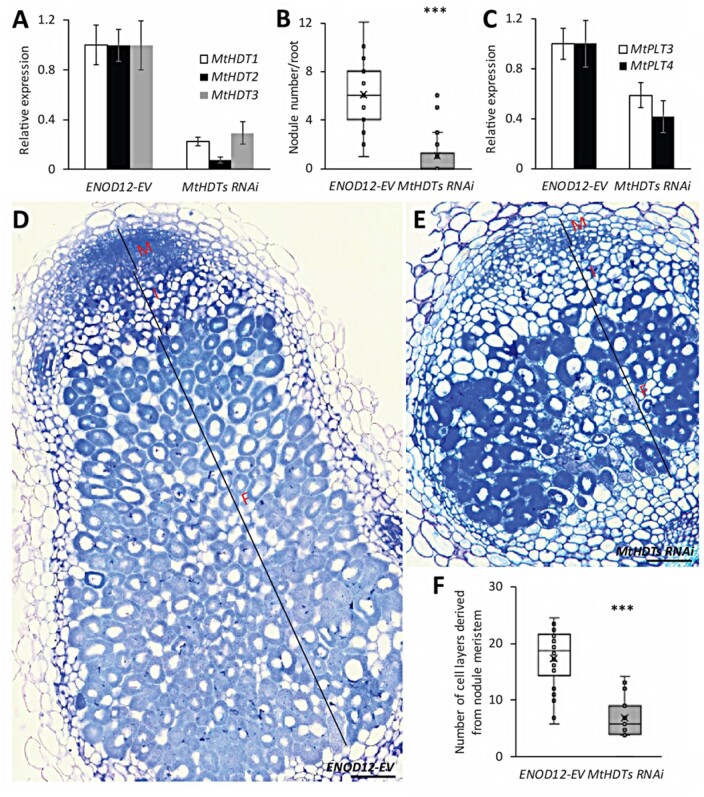
Knockdown of MtHDTs affects nodule meristem functioning and rhizobial colonization. A, Reverse transcription quantitative PCR (RT-qPCR) analysis of MtHDTs expression in ENOD12-EV control and MtHDTs RNAi nodules. B, Nodule number formed per ENOD12-EV and MtHDTs RNAi transgenic root (n > 20 roots). C, RT-qPCR analysis of MtPLT3, 4 expression in ENOD12-EV control, and MtHDTs RNAi nodules. D and E, Morphology of ENOD12-EV (D) and MtHDTs RNAi (E) nodules studied by light microscopy. Representative longitudinal sections are shown. The nodule meristem (M), infection zone (I), and fixation zone (F) are marked. Scale bars = 100 µm. Magnifications of nodule infection zone are shown in Supplemental Figure S6. F, Number of cell layers derived from nodule meristem in ENOD12-EV and MtHDTs RNAi transgenic nodules (n > 15). Nodules were harvested at 21 dpi. Panels in A and C show mean ± SEM determined from three independent experiments. Asterisks in B and F indicate significant differences (***P < 0.001; Student’s t test).

