Figure 1.
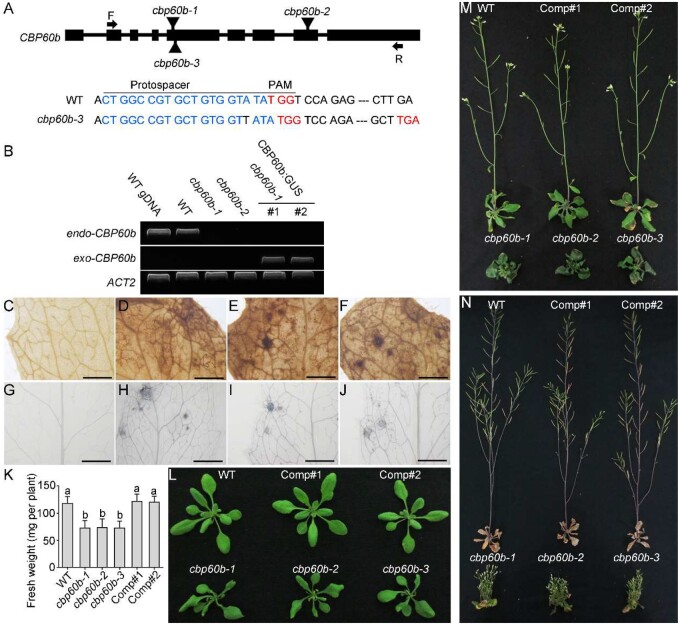
Functional loss of CBP60b compromised plant growth. A, Schematic illustration of CBP60b genomic locus. Boxes represent exons. T-DNA insertions (cbp60b-1 and cbp60b-2) and CRISPR/Cas9-generated cbp60b-3 are labeled on the genomic locus. A base pair insertion at the protospacer region caused a pre-stop codon of CBP60b in cbp60b-3. PAM sequences and stop codons are indicated in red; protospacer sequences are indicated in blue. B, Transcript analysis showing endogenous and exogenous CBP60b in various genetic backgrounds. C–F, Representative DAB staining for hydrogen peroxide in WT (C), cbp60b-1 (D), cbp60b-2 (E), or cbp60b-3 (F). G–J, Representative Trypan blue staining for the level of cell death in WT (G), cbp60b-1 (H), cbp60b-2 (I), or cbp60b-3 (J). K, Fresh weight of the indicated genotypes. Values are means ± standard deviation (sd, n > 15). Different letters indicate significantly different groups (one-way ANOVA, Tukey’s multiple comparisons test, P < 0.05). L–N, Representative plant growth at three WAG (L), five WAG (M), or seven WAG (N). Comp indicates CBP60b:GUS;cbp60b-1 lines. Bars = 1 mm. See also Supplemental Figures S1, S2.

