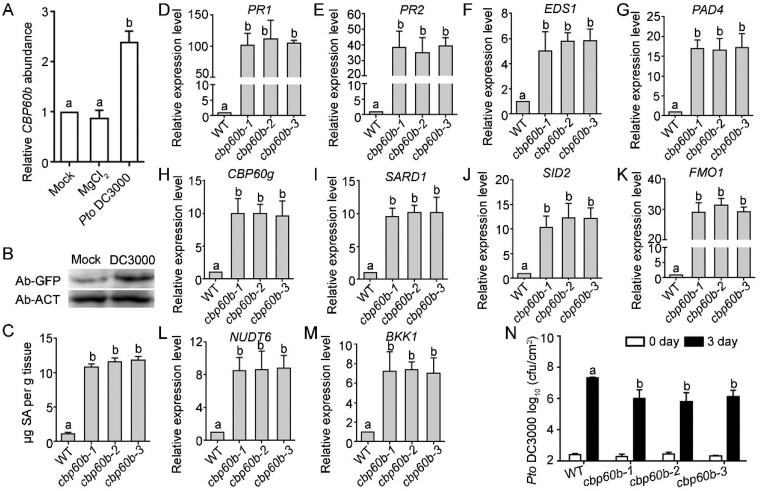
Figure 2.
Immune response is constitutively activated in CBP60b loss-of-function. A and B, Transcript analysis of CBP60b by RT-qPCRs (A) or western blot analysis showing protein abundance of CBP60b-GFP (in plants transformed with CBP60b genomic:GFP translational fusion construct (CBP60b:GFP)) at 24 h after infiltration (B). For A, values are means ± se (n = 3). Each biological replicates include leaves from five plants. Different letters indicate significantly different groups (one-way ANOVA, Tukey’s multiple comparisons test, P < 0.05). Anti-ACTIN was used as the internal loading control in the Western blot assays. C, Total SAs in the indicated genotypes. Values are means ± sd (n = 4). Each biological replicate includes the fifth to sixth leaves from >10 plants. Different letters indicate significantly different groups (one-way ANOVA, Tukey’s multiple comparisons test, P < 0.05). D–M, Relative transcript abundance of immune genes, including PR1 (D), PR2 (E), EDS1 (F), PAD4 (G), CBP60g (H), SARD1 (I), SID2 (J), FMO1 (K), NUDT6 (L), and BKK1 (M). Values are means ± se (n = 3). Different letters indicate significantly different groups (one-way ANOVA, Tukey’s multiple comparisons test, P < 0.05). N, Sensitivity of the indicated genotypes to Pto DC3000. Plants at five WAG were infiltrated with Pto DC3000 (OD600 = 0.0001). Bacterial growth was determined 2 h post-inoculation (0 day) or 3 d post-inoculation (3 d). cfu, colony-forming unit. Values are means ± sd (n = 4). Different letters indicate significantly different groups (one-way ANOVA, Tukey’s multiple comparisons test, P < 0.05). Experiment was repeated three times with similar results. See also Supplemental Figures S1–S3.

