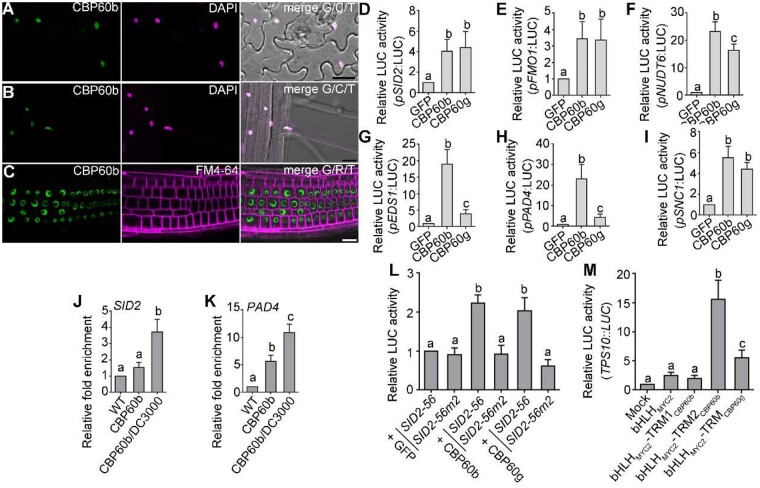
Figure 3.
CBP60b positively regulates immune gene expression. A–C, Representative CLSM of leaf pavement cells (A) from the CBP60b:GFP;cbp60b plants at three WAG, CLSM of root elongation zone (B) or root meristematic zone (C) from the CBP60b:GFP;cbp60b seedlings at five DAG. DAPI staining (magenta) was used to show the nuclei in (A and B). FM4-64 staining was used to show the PM in (C). A–C, bars = 20 μm. D–I, Quantitative luminescence comparison showing the LUC activity of pSID2:LUC (D), pFMO1:LUC (E), pNUDT6:LUC (F), pEDS1:LUC (G), pPAD4:LUC (H), and pSNC1:LUC (I). The promoter:LUC constructs were co-transfected with 35S:GFP (GFP), 35S:CBP60b-GFP (CBP60b), or 35S:CBP60g-HA (CBP60g). Values are means ± se (n = 4). J and K, ChIP-PCRs of CBP60b on SID2 (J) and PAD4 (K). ChIP signal was quantified as the percentage of total input DNA by qPCR, and normalized to corresponding fragment in WT (set as 1). Plants used are WT or cbp60b-1 complemented with the CBP60b genomic:GFP fusion construct (CBP60b:GFP;cbp60b, labeled on figure as CBP60b). For Pto DC3000 treatment, CBP60b:GFP;cbp60b plants at 5 WAG were infiltrated with Pto DC3000 (OD600 = 0.0001) 24 h before collecting and cross-linking with 1% formaldehyde. Values are means ± se (n = 3). L, Quantitative luminescence comparison. SID2-56:LUC or SID2-56m:LUC containing two mutations of gaaatt to gaaggg at the consensus motifs of pSID2 (SID2-56m2) was co-expressed with 35S:GFP, 35S:CBP60b-GFP, or 35S:CBP60g-HA. M, Quantitative luminescence comparison. TPS10::LUC was transfected with 35S:GFP (mock), 35S:bHLHMYC2-GFP, 35S:bHLHMYC2-TRM1CBP60b-GFP, 35S:bHLHMYC2-TRM2CBP60b-GFP, or 35S:bHLHMYC2-TRMCBP60g-GFP. LUC reporter activity was determined 16 h post-transfection. Values are means ± se (n = 4). From (D) to (M), different letters indicate significantly different groups (one-way ANOVA, Tukey’s multiple comparisons test, P < 0.05). See also Supplemental Figures S4, S5.

