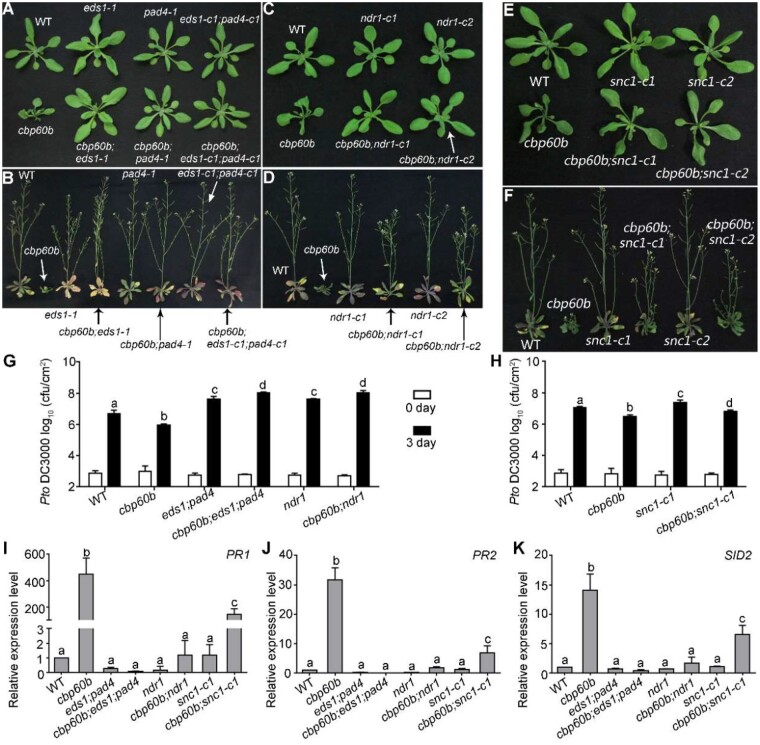
Figure 5.
The autoimmunity of cbp60b was fully suppressed by mutations at EDS1-PAD4 and partially suppressed by mutations at NDR1 or SNC1. A and B, Representative growth of WT, cbp60b, eds1-1, pad4-1, eds1-c1;pad4-c1, cbp60b;pad4-1, cbp60b;eds1-1, and cbp60b;eds1-c1;pad4-c1 at three WAG (A) or five WAG (B) under LD conditions. C and D, Representative growth of WT, cbp60b, ndr1-c1, ndr1-c2, cbp60b;ndr1-c1, and cbp60b;ndr1-c2 at three WAG (C) or five WAG (D) under LD conditions. Arrows in (A–D) were used to point at the plant with specified genotype. E and F, Representative growth of WT, cbp60b-1, snc1-c1, snc1-c2, cbp60b-1;snc1-c1, and cbp60b-1;snc1-c2 at three WAG (E) or five WAG (F) under LD conditions. G and H, Sensitivity of the indicated genotypes to Pto DC3000. Plants at five WAG were infiltrated with Pto DC3000 (OD600 = 0.0001). Bacterial growth was determined 2 h post-inoculation (0 day) or 3 d post-inoculation (3 d). Values are means ± sd (n = 4). Experiment was repeated three times with similar results. I–K, Relative transcript abundance of PR1 (I), PR2 (J), and SID2 (K). Values are means ± se (n = 4). RNAs were extracted from leaves of three WAG plants under LD conditions. Results are means ± se (n = 3). Different letters in (G–K) indicate significantly different groups (one-way ANOVA, Tukey’s multiple comparisons test, P < 0.05). See also Supplemental Figures S6–S10.

