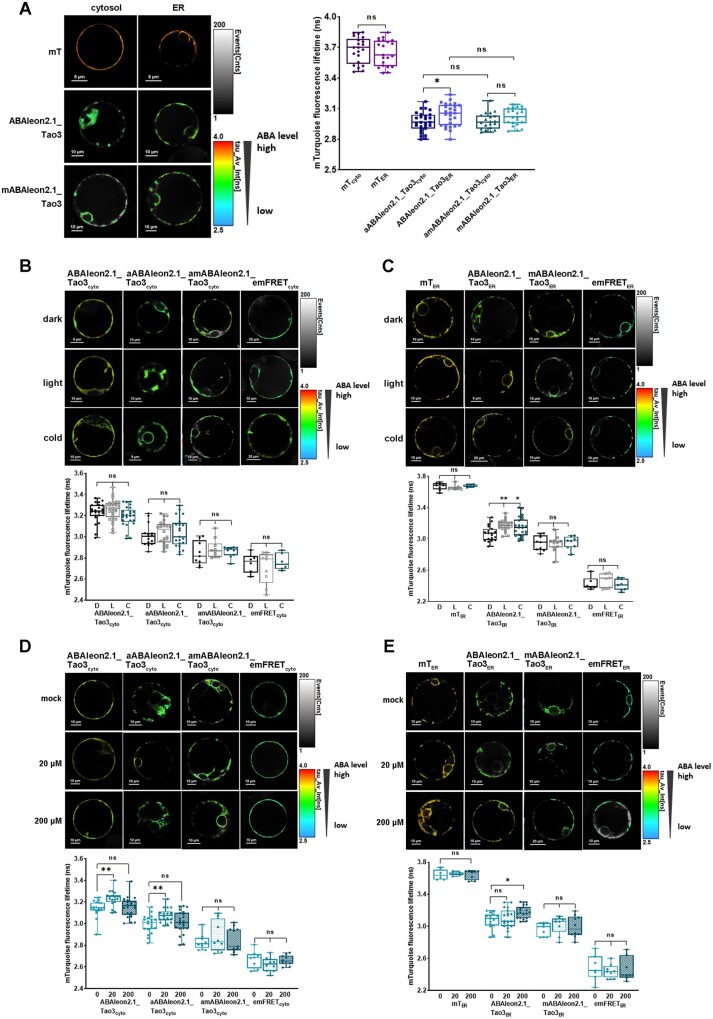
Figure 3.
FRET–FLIM analysis reveals a higher basal amount of ABA in the ER and specific increases in the ER ABA upon different environmental stimuli. A, FLIM images and data showing generally lower τmT in the aABAleon2.1_Tao3cyto compared with that of ABAleon2.1_Tao3ER. The donor-only control mTcyto and ER-membrane anchored non-responsive ABAleon2.1_Tao3 in the cytosol (amABAleon2.1_Tao3cyto) displayed similar levels of τmT compared with their counterparts in the ER (mTER and mABAleon2.1_Tao3ER), respectively. FLIM values are presented as box plot with all data points. Statistical analysis was performed using Student’s t test (*P < 0.05; ns, not significant). B, C, Representative FLIM images and data show little responses of the τmT in the cytosolic ABAleon2.1_Tao3s (B) but evident increases in the τmT in ABAleon2.1_Tao3ER (C) 6 h after dark (D, 25°C), light (L, 25°C), and cold (C, 4°C, dark) treatment. The non-responsive ABAleon2.1_Tao3s (amABAleon2.1_Tao3cyto and mABAleon2.1_Tao3ER), donor-only control mTER, and empty FRET controls (emFRETcyto and emFRETER) showed similar levels of τmT under all three conditions. The fluorescence lifetime values are shown as box bars with all data points. Statistical analysis was performed using one-way ANOVA followed by Dunnett’s multiple comparisons test (**P < 0.01; *P < 0.05 for difference between different stimulus and dark control treatment; ns, not significant). D, E, Representative FLIM images and data show specific responses of the τmT in cytosolic ABAleon2.1_Tao3s (D) and in the ABAleon2.1_Tao3ER (E) at 6 h after 20-μM, 200-μM MgSO4, or mock treatment. The nonresponsive ABAleon2.1_Tao3s (amABAleon2.1_Tao3cyto and mABAleon2.1_Tao3ER), donor-only control mTER, and empty FRET controls (emFRETcyto and emFRETER) showed minor responses to both sulfate treatments. The fluorescence lifetime values are shown as box bars with all data points. The fluorescence lifetime values are shown as bars showing means ± SE. Statistics were performed using one-way ANOVA followed by Dunnett’s multiple comparisons test (**P < 0.01; *P < 0.05 for difference between sulphate and control treatment; ns, not significant)

