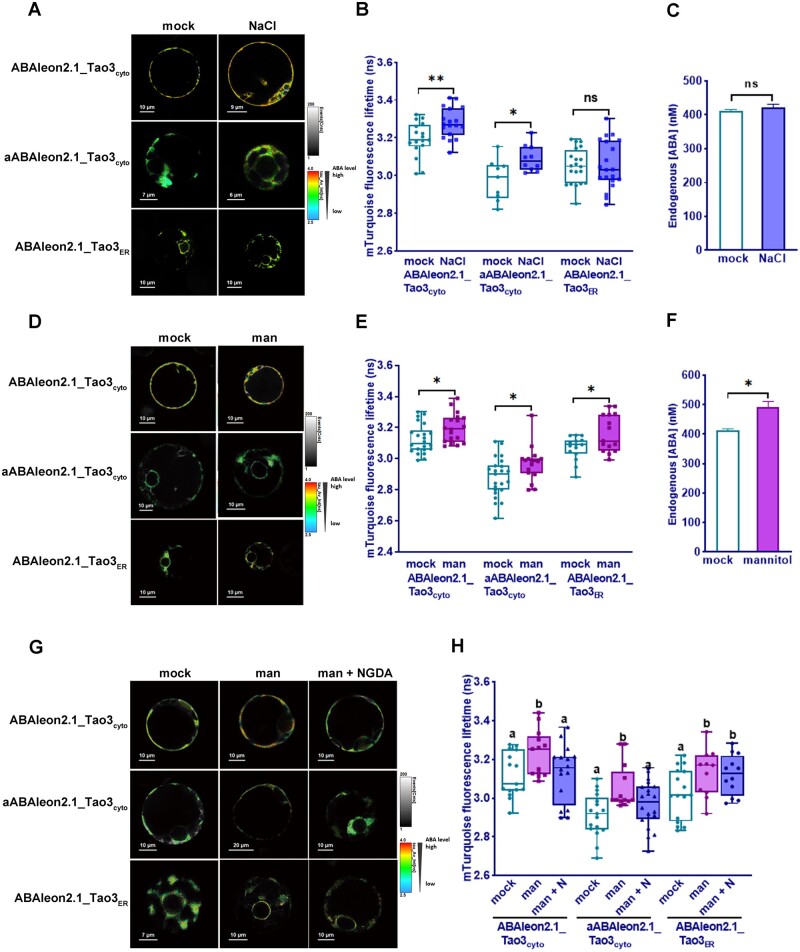
Figure 4.
Osmotic stresses induce accumulation of ABA in the cytosol and the ER in tobacco protoplasts. A–C, FLIM images (A) and data (B) of ABAleon2.1_Tao3cyto, aABAleon2.1_Tao3cyto, and ABAleon2.1_Tao3ER endogenous ABA concentrations (C) at 6 h after NaCl (10 mM) treatment. D–F, FLIM images (D) and data (E) of ABAleon2.1_Tao3cyto, aABAleon2.1_Tao3cyto, and ABAleon2.1_Tao3ER endogenous ABA concentrations (F) at 6 h after 50-mM mannitol (man) treatment. The fluorescence lifetime values are presented as box plots showing all data points. n = 15–24. Endogenous ABA values are indicated as bar plots showing means ± se. n = 9. Statistics was performed using Student’s t test (**P < 0.01; *P < 0.05; ns, not significant). G–H, FLIM images (G) and data (H) showed inhibition of NGDA on osmotic stress induced increases in cytosolic ABA but not ER ABA. Samples were recorded 6 h after treatment with 50-mM mannitol (man) or 100-μM NGDA (N). FLIM data are presented as box plots showing all data points. Statistical analysis was performed using one-way ANOVA, followed by Fisher’s LSD test (different letters indicate statistically significant differences among different treatments, P < 0.05)

