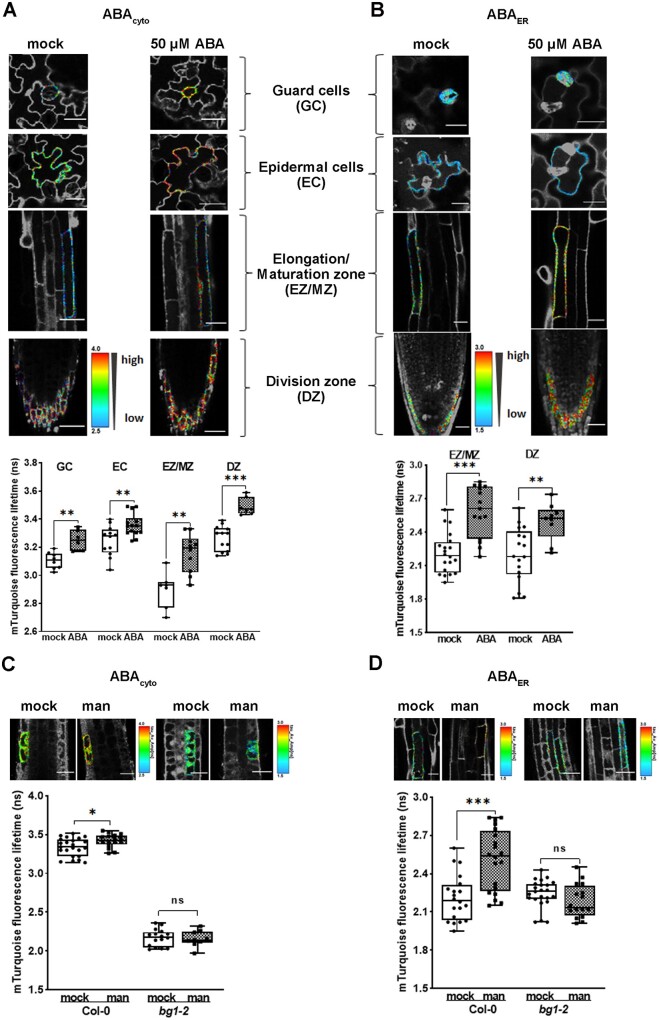
Figure 6.
ABAleon2.1_Tao3s responses in Arabidopsis seedlings upon ABA and mannitol application. A, B, FLIM images and data showing substantial inductions of both cytosolic (A) and ER ABA (B) in different Arabidopsis tissues 1 h after application of 50-μM ABA. The GC/EC data of ABAER was not included as the signals in the leaves of ABAleon2.1_Tao3ER were generally low and did not produce enough recordings for experimental analysis. The colored calibration bars indicate higher ABA concentrations with high τmT (red) and lower ABA concentrations with low τmT (blue). C, D, FLIM images and data reveal increases in ABAcyto (C) and ABAER (D) within 1 h upon 200-mM mannitol treatment in root meristem zone and elongation/maturation zone, respectively, in wild-type Col-0 but not in the root of the mutant bg1-2. FLIM data are presented as means ± se. Statistical analysis performed using Student’s t test (*P < 0.01; ***P < 0.001; ns, not significant)

