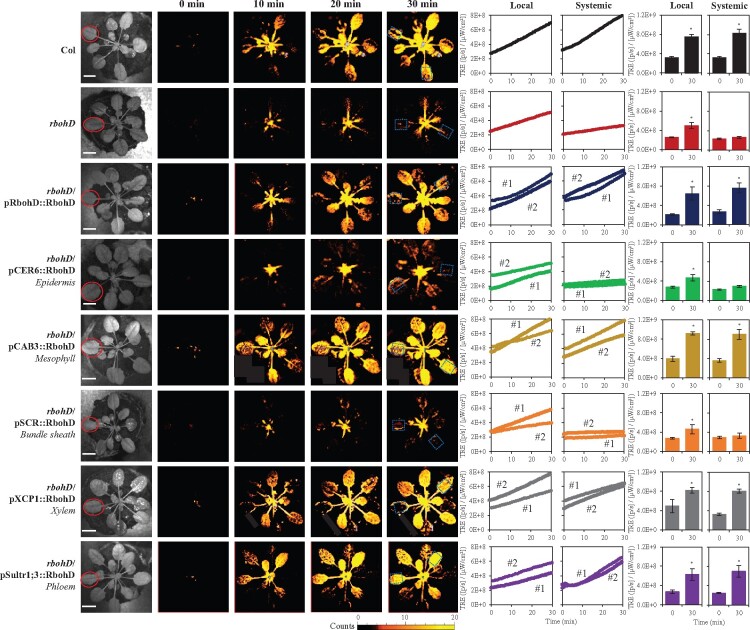
Figure 2.
Complementation of HS-induced local and systemic ROS signaling in the rbohD mutant with RBOHD driven by different tissue-specific promoters. Representative time-lapse images of whole-plant ROS levels in wild-type, rbohD and the different rbohD-complemented A. thaliana plants subjected to a local HS treatment (red circles), are shown on left; representative line graphs showing continuous measurements of ROS levels in local and systemic leaves of wild-type, rbohD, and two independent homozygous complemented lines (#1 and #2), over the entire course of the experiment (0–30 min) are shown in the middle (ROIs for some of them are indicated with blue boxes); and statistical analysis of ROS levels in local and systemic leaves at 0 and 30 min is shown on right (Student’s t test, sd, N = 10, *P < 0.05). All experiments were repeated at least three times with similar results. Scale bar indicates 1 cm. CER, eceriferum; CAB, chlorophyll A/B binding protein; SCR, scarecrow; XCP, xylem cysteine peptidase; ROI, region of interest; Sultr, sulfate transporter; TRE, total radiant efficiency.

