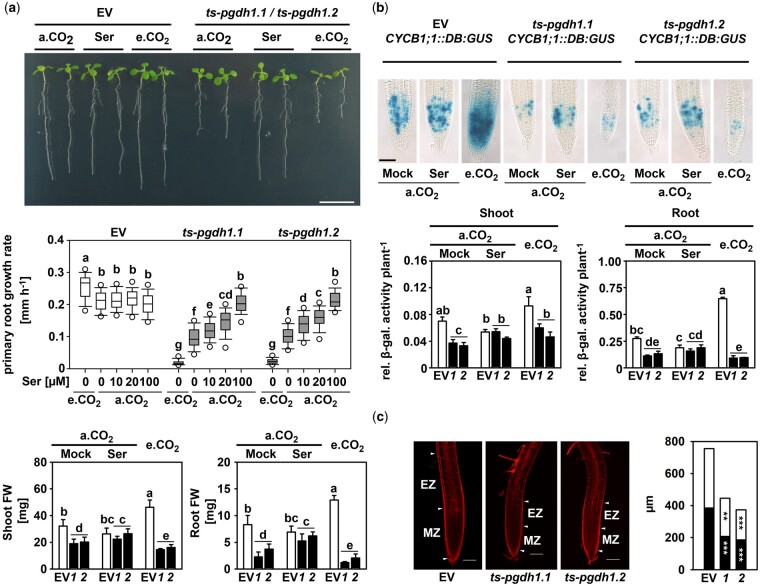
Figure 1.
PGDH1-deficiency inhibits cell division and elongation. A, PRGR and plant biomass of EV control plants and PGDH1-silenced plants (ts-pgdh1.1 [1] or ts-pgdh1.2 [2]) were determined under different growth conditions: a.CO2 (ambient CO2, 400 µL L−1), a.CO2 supplemented with 0.1-mM serine (Ser) and e.CO2 (elevated CO2, 4,000 µL L−1). Scale bar = 1 cm. Primary root growth rate was determined at a.CO2, e.CO2 and at a.CO2 with increasing serine concentration. Data (n > 20) are shown as box plot; the line represents median; the whiskers represent 1.5 interquartile range (IQR) and dots show 5th/95th percentiles. FW of shoots and roots are the mean ± sd of n > 5. B, CYCB1;1::DB:GUS expressing plants were transformed with the PGDH1 silencing construct and cultivated under different conditions. GUS activity was visualized by histological staining with X-Gluc for 12 h at 37°C (Scale bar = 50µm) or quantified by a fluorescent β-galactosidase assay. Values are the mean and se of n = 5. For (A) and (B), one-way analysis of variance (ANOVA) followed by Fisher’s least significant difference test (P < 0.05) were performed and columns with the same letter are not significantly different. C, Roots were stained with propidium iodine and cell size and number were analyzed by confocal laser scanning microscopy. Black bars represent the size of the meristem zone (MZ) and white bars represent the size of the first 11 cells above the transition zone, also called elongation zone (EZ). White arrowheads mark the boundaries of the MZ and EZ. Scale bars indicate 100 µm. The cell area and meristem size were determined using the ImageJ software. Data presented are means ± se of n > 11. Asterisks indicate significantly different values between EV control plants and PGDH1-silenced lines by the Student’s t test (**P < 0.01; ***P < 0.001).

