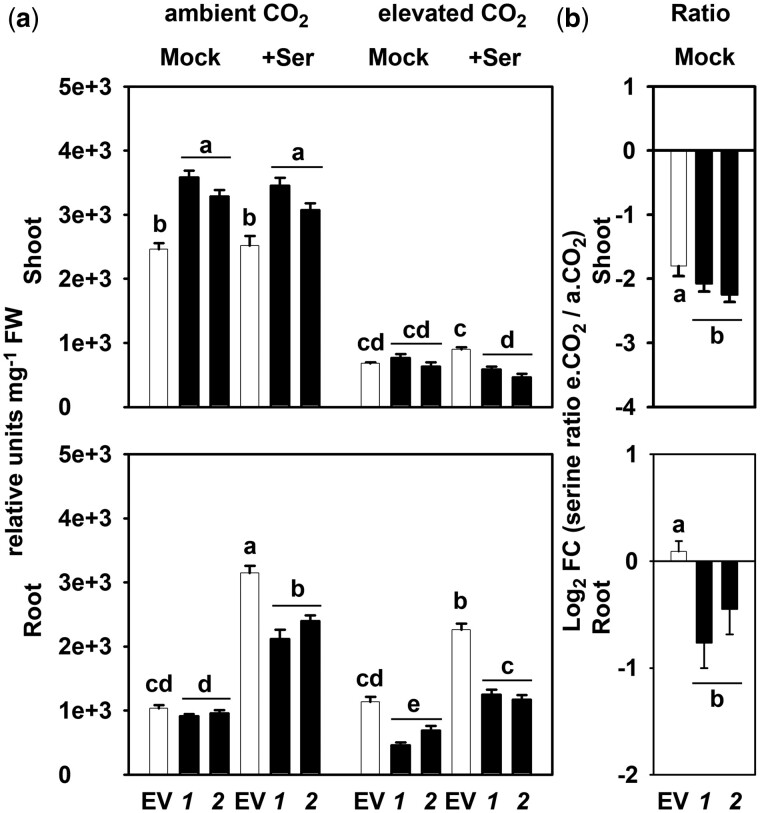
Figure 4.
Contribution by photorespiration and PPSB to the steady-state serine content in plants. A, Total serine content in shoot and root tissues of EV and PGDH1-silenced lines (1 and 2), grown at different conditions, a.CO2 (ambient CO2, 400 µL L−1), +Ser (supplemented with 0.1-mM serine), and e.CO2 (elevated CO2, 4,000 µL L−1). B, Calculated ratio between serine levels determined at ambient and elevated CO2. Values are shown as Log2 fold change (FC). For (A) and (B), data are presented as mean ± se of n = 8; one-way ANOVA followed by Fisher’s least significant difference test (P < 0.05) were performed and columns with the same letter are not significantly different.

