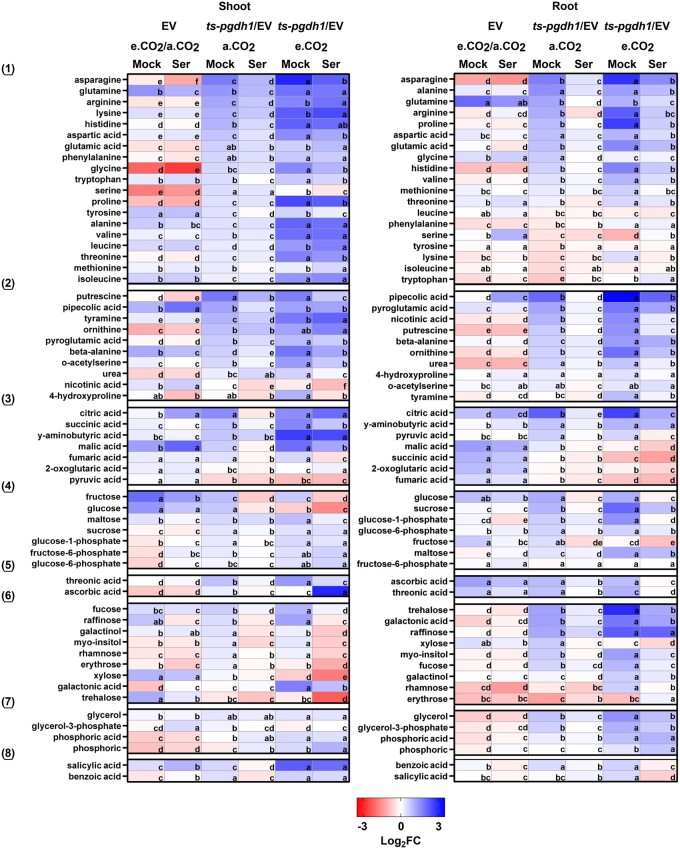
Figure 5.
Changes in metabolite composition in response to the inhibition of photorespiration or PPSB. Changes in the content of metabolites extracted from shoot and root tissues of EV control plants and PGDH1-silenced lines (ts-pgdh1.1 and ts-pgdh1.2) grown at a.CO2 (ambient CO2, 400 µL L−1) and e.CO2 (elevated CO2, 4,000 µL L−1) with 0.1-mM serine (Ser) or without (Mock) in the growth medium. Data are presented as heatmap. Blue indicates elevated metabolite content and red indicates decreased metabolite content. Data are presented as Log2 FC. To simplify the data presentation, the average between the values obtained for ts-pgdh1.1 and ts-pgdh1.2 (i.e. “ts-pgdh1” in figure) was used for all calculations. For EV, the ratio (Log2 FC) of measured analytes in plants grown under a.CO2 and e.CO2 (a.CO2/e.CO2) is presented. Metabolites were grouped into (1) amino acids, (2) nitrogen-containing compounds, (3) organic acids related to respiratory metabolism, (4) carbohydrates and glycolytic intermediates, (5) organic acids, (6) carbohydrates, (7) sugar alcohols and phosphoric ester, and (8) aromatic compounds. Data are means of n = 8. One-way ANOVA followed by Fisher’s least significant difference test (P < 0.05) were performed and fields within one raw with the same letter are not significantly different.

