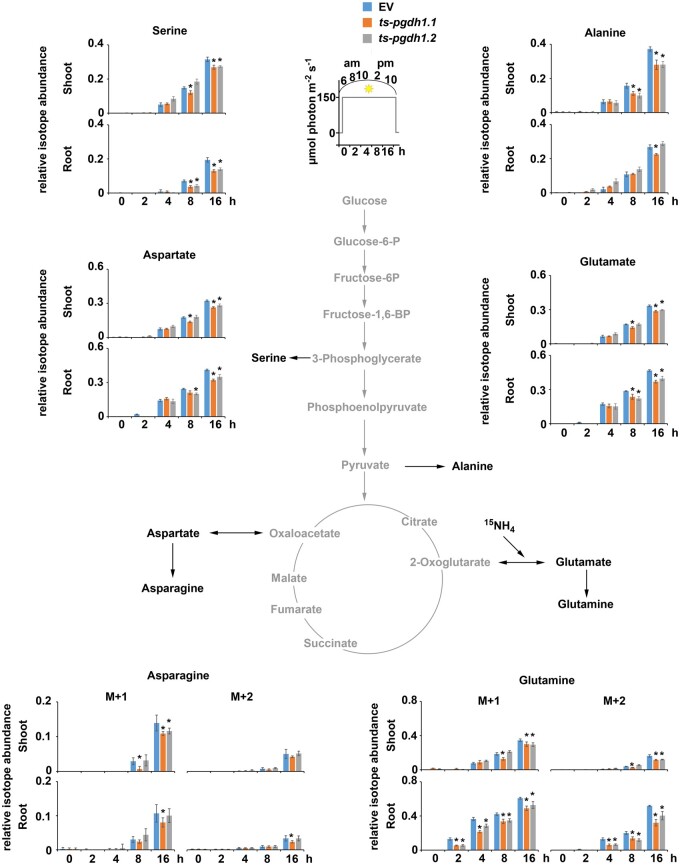
Figure 7.
Changes in the RIA in PGDH1-silenced lines. Based on the 15N-enrichment in major amino acids, the RIA was calculated for the individual amino acids in shoot and root tissues of EV control plants and PGDH1-silenced lines (ts-pgdh1.1 and ts-pgdh1.2) grown in a 16-h time course (see inset). Data presented are means ± se of n = 5. Asterisks indicate significantly different values between EV and PGDH1-silenced lines by the Student’s t test (*P < 0.05).

