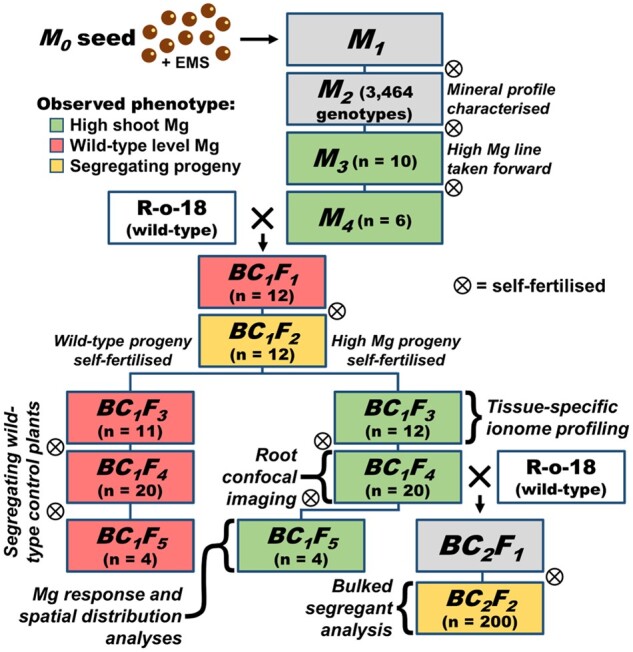
Figure 1.

Descent of B. rapa braA.sgn3.a-1 from EMS application to M0 seed, through two backcrosses to wild-type (WT) R-o-18, leading to high and low Mg segregant groups and segregating F2 populations. Cell color represents Mg phenotype among sibling plants (where analyzed) where green = high Mg phenotype in all sibling plants, red = low Mg phenotype in all sibling plants, and yellow = segregating sibling plants. Specific analyses performed indicated next to relevant generations for reference. M = mutant generation. BC = back-cross. F = filial generation.
