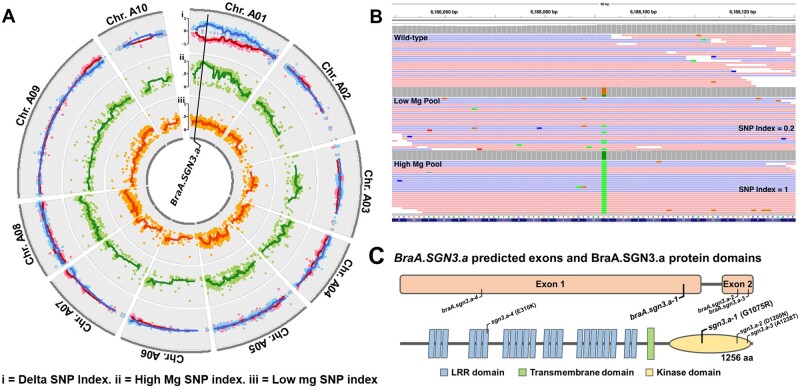
Figure 3.
Genetic characterization of braA.sgn3.a-1. A, SNP Indices representing allelic depth of called, filtered SNPs in low (track iii; orange) and high (track ii; green) magnesium (Mg) DNA pools with delta SNP index shown as high minus low Mg (blue) and low minus high Mg (red) SNP indices (track i). Dots represent individual SNPs. Lines represent moving average SNP index around each SNP ± 9 SNP calls. Genomic location of BraA.SGN3.a indicated. B, Allelic frequency (SNP index) of high confidence SNP within BraA.SGN3.a in R-o-18 and high and low Mg DNA pools. Twenty-five randomly selected reads shown for each pool; for all reads see Supplemental Figure S3). C, BraA.SGN3.a predicted exons and BraA.SGN3.a protein domains (as predicted by ExPASy Prosite and TMHMM 2.0). Genomic location of braA.sgn3.a-1 mutation and candidate alternative alleles shown, with predicted amino acid change.

