Figure 4.
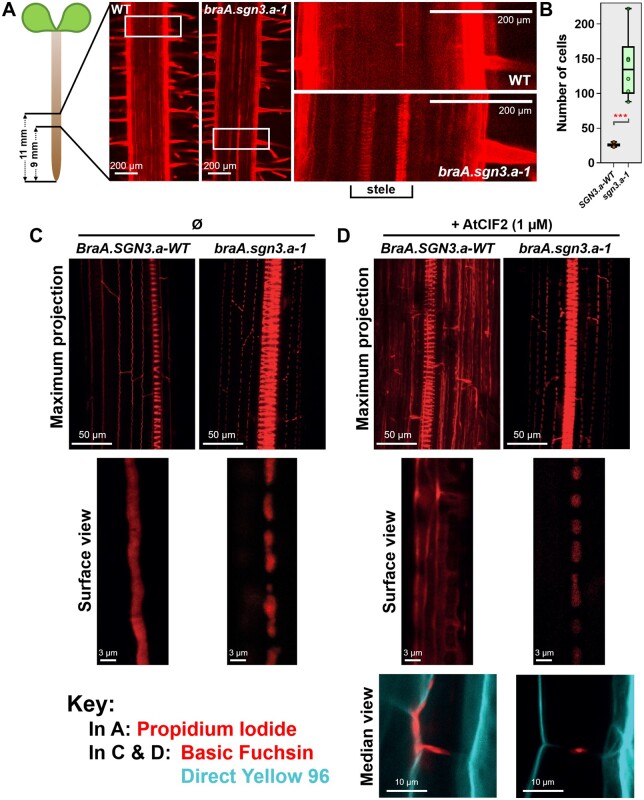
Characterization of root endodermal barrier anatomy. A, Confocal images of 5-d-old roots of R-o-18 WT and braA.sgn3.a-1 mutant plants stained with PI (shown in red). Images are centered approximately 10 mm from root tip. Regions of 1.55 × 0.78 mm shown on left side. White boxes indicate position of enlarged regions shown to the right. Note visibility of xylem tissue in stele of braA.sgn3.a-1, indicating perturbed endodermal barrier. B, Number of epidermal cells from the onset of elongation until the endodermal cells blocked the PI penetration to the stele of roots of BraA.SGN3.a-WT (SGN3.a-WT) and braA.sgn3.a-1 (sgn3.a-1) mutant plants. Boxes represent interquartile range with the median shown. Whiskers show entire data range, with data points shown. Stars represent difference (two-tailed T test) between braA.sgn3.a-1 and BraA.SGN3.a-WT at P < 0.001. C, Confocal images of 4-d-old roots of BraA.SGN3.a-WT and braA.sgn3.a-1 stained with the lignin stain Basic Fuchsin (shown in red). Roots were imaged at 40 cells after the onset of elongation. Maximum projection of Z-stack of endodermal cells and enlarged surface view of the top of endodermal cells shown. Note non-contiguous lignin band in braA.sgn3.a-1, indicating a disrupted endodermal barrier. D, Confocal images of 4-d-old roots of BraA.SGN3.a-WT and braA.sgn3.a-1 as in (C) but in the presence of exogenous AtCIF2 peptide. Basic Fuchsin shown in red. Note ectopic lignin deposits in roots of BraA.SGN3.a-WT in the presence of AtCIF2, whereas braA.sgn3.a-1 fails to show a similar response. Endodermal cell median view shown below, with additional Direct Yellow 96 staining shown in cyan to visualize cellulose/cell wall.

