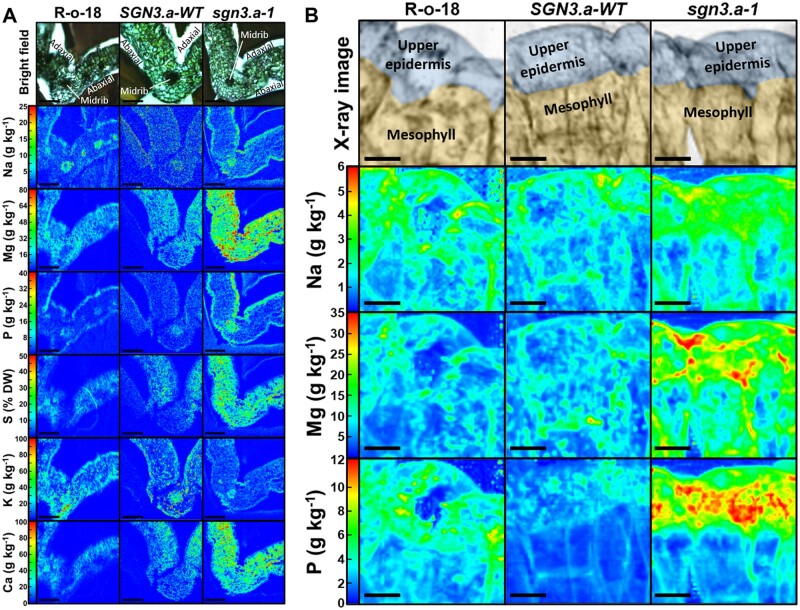
Figure 5.
Leaf spatial distribution of elements. A, Quantified spatial distributions of sodium (Na) magnesium (Mg), phosphorus (P), sulphur (S), potassium (K), and calcium (Ca) in representative first or second leaves of R-o-18, BraA.SGN3.a-WT (SGN3.a-WT) and braA.sgn3.a-1 (sgn3.a-1) as analyzed by micro-particle induced X-ray emission (µPIXE). Scale bar = 200 µm. B, Quantified spatial distributions of Na, Mg, and P in upper epidermal and mesophyll cells of R-o-18, SGN3.a-WT and sgn3.a-1 as analyzed by X-ray fluorescence. Scale bar = 20 µm. X-ray images in top panels digitally colored to show localization of upper epidermis and mesophyll.

