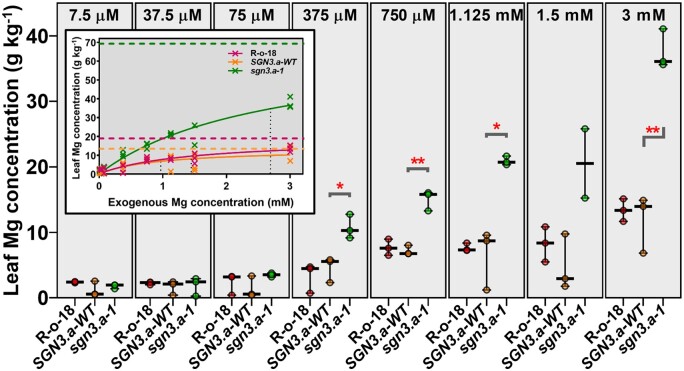
Figure 6.
Leaf Mg concentrations of BC1F5 plants grown under different exogenous Mg concentrations (indicated at top of each panel). Median value plotted in each panel where whiskers represent range with data points shown (n = 3 for each genotype for each treatment). braA.sgn3.a-1 abbreviated to sgn3.a-1, BraA.SGN3.a-WT abbreviated to SGN3.a-WT. Stars represent differences (two-tailed T tests) between braA.sgn3.a-1 and BraA.SGN3.a-WT at *P < 0.05 and **P < 0.01. Figure inset shows Michaelis–Menten kinetics curves for each genotype with Vmax and Km lines shown as dashed and dotted lines, respectively

