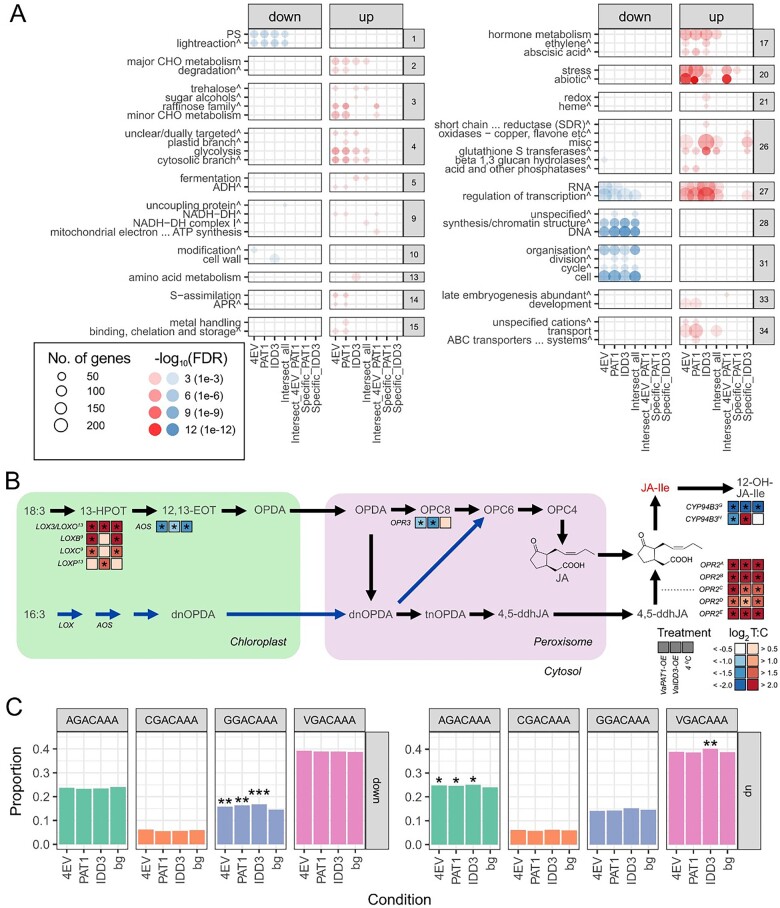
Figure 3.
Comparative transcriptome analysis of grapevine Cold (4EV), OE-VaPAT1 (PAT1), and OE-VaIDD3 (IDD3) DE genes. A, Enriched BIN categories (FDR < 0.05, BIN depth ≤ 1). The circle size and the circle color depict the number of genes in each enriched category and the parent BIN category of each BIN, respectively. Enrichment scores (expressed as—log10 FDR) for each BIN category are shown. Red and blue colors indicate upregulated and downregulated genes, respectively. B, Simplified scheme of two alternative plant JA biosynthesis pathways. Only differentially expressed pathway genes are indicated. See main text for gene accessions. Pathway constituents (indicated in gray text) are 18:3, α-linolenic acid; 16:3, hexadecatrienoic acid; 13-HPOT, (13S)-hydroperoxyoctadecatrienoic acid; 12,13-EOT, 12,13(S)-epoxy-octadecatrienoic acid; OPC-6, 6-(3-oxo-2-(pent-2-enyl)cyclopentyl)hexanoic acid; OPC-4, 4-(3-oxo-2-(pent-2-enyl)cyclopentyl)butanoic acid; dnOPDA, dinor-OPDA; tnOPDA, tetranor-OPDA; 4,5-ddhJA, 4,5-didehydro-JA; JA-Ile, JA-Isoleucine; and 12-OH-JA-Ile, 12-Hydroxy-JA-Ile. The bioactive JA (JA-Ile) is indicated in red text. Black and blue pathway arrows define the octadecanoid and parallel hexadecanoid pathway, respectively. Asterisks denote significant DE (absolute log2 FC > 1, FDR < 0.05) between contrast. LOX, lipoxygenase; OPR, OPDA reductase; CYP94B3, JA-Ile-12-hydroxylase. C, Proportion of DEGs containing the IDD-box (VGACAAA, V = A/C/G) CRE in the promoter region of 4EV, OE-VaPAT1, OE-VaIDD3 DE genes. *FDR < 5.0E−02, **FDR between 1.0E−02 and 1.0E−03, and ***FDR < 4.0E−04 indicate significantly enriched CRE.

