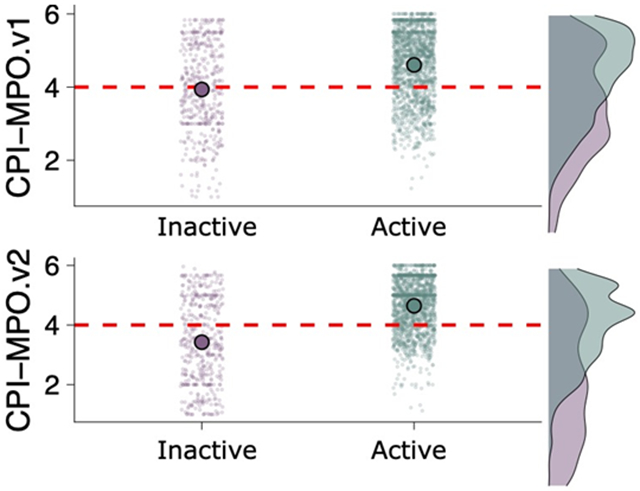
Figure 6.

Comparison of CPI-MPO.v1 and CPI-MPO.v2 scores at predicting BBB penetration from a binary dataset 13. Green (x-axis: 1) represents active (BBB penetrating) compounds and purple (x-axis: 0) represents inactive (BBB non-penetrating) compounds from the testing dataset. The red dashed line indicates the activity cutoff (active if ≥ 4), and the large dot represents mean CPI-MPO scores of the entire testing dataset. Normalized density plots to the right of each point-graph.
