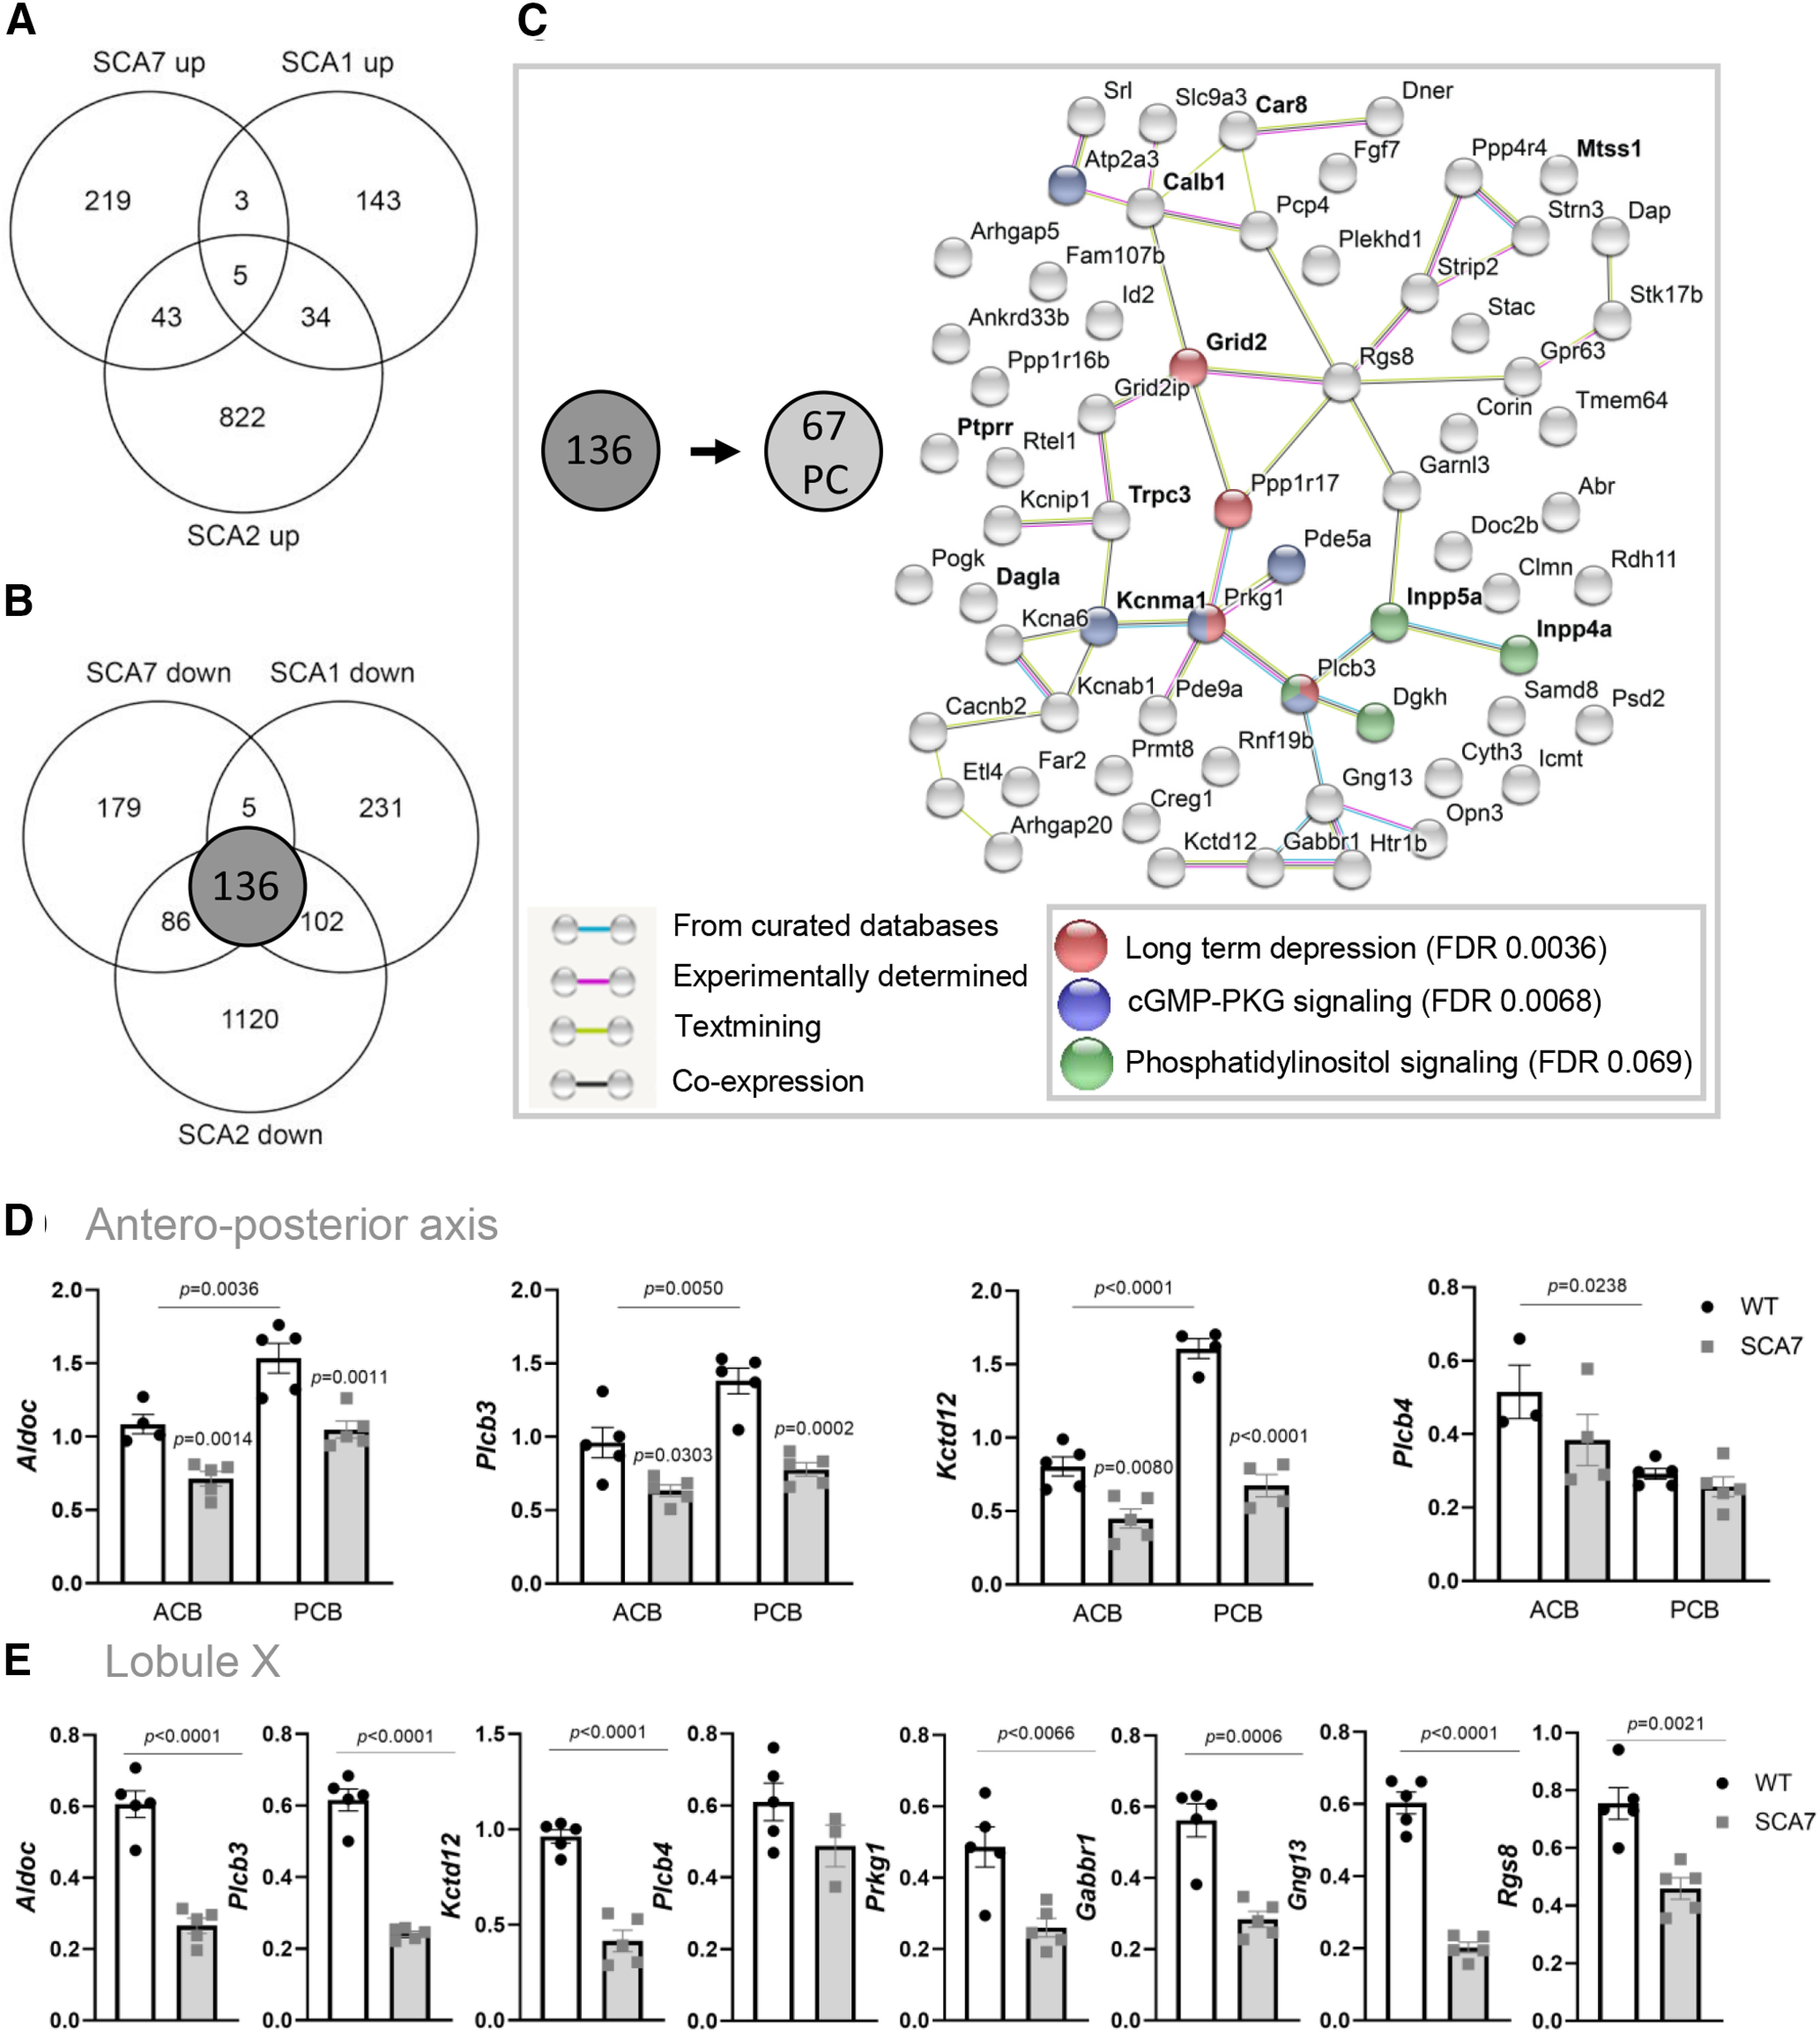
Figure 12.

Downregulation of PC identity genes in SCA1, SCA2, and SCA7 and network analysis. A, B, Venn diagrams show overlap between genes upregulated (A) and downregulated (B) in SCA1 (5-week-old) (Ingram et al., 2016), SCA2 (6-week-old) (Dansithong et al., 2015), and SCA7140Q/5Q cerebellum. C, Genetic network showing functional partnerships and interactions between proteins encoded by the 67 PC genes downregulated in SCA1, SCA2, and SCA7 mouse models, as determined using the STRING software. Bold type represents known ataxia genes. Bottom right, Functional annotations of the 67 PC-enriched genes downregulated in SCA1, SCA2, and SCA7 mouse models, using KEGG pathway analysis. D, qRT-PCR analyses of ACB (ZII– enriched lobules II-V) and PCB (ZII+ enriched lobule VI-IX) vermal cerebella of SCA7140Q/5Q and WT mice show strong downregulation of ZII+ associated genes (Aldoc, Plcb3, Kctd12) in PCB of SCA7 mice compared with WT, whereas the expression of ZII– associated gene Plcb4 is not affected in ACB and PCB. Data are normalized to the 36B4 level and are expressed as mean ± SEM. Ordinary two-way ANOVA, followed by post hoc Bonferroni test. E, qRT-PCR analyses of ZII+ enriched lobule X show strong downregulation of ZII+ associated genes (Aldoc, Plcb3, Kctd12) and 4 other genes (Prkg1, Gabbr1, Gng13, Rgs8) from the downregulated network (C), in SCA7 mice compared with WT. The ZII– associated gene Plcb4 is not affected in SCA7 lobule X. Data are normalized to the 36B4 level and are expressed as mean ± SEM. Two-tailed Student's t test.
