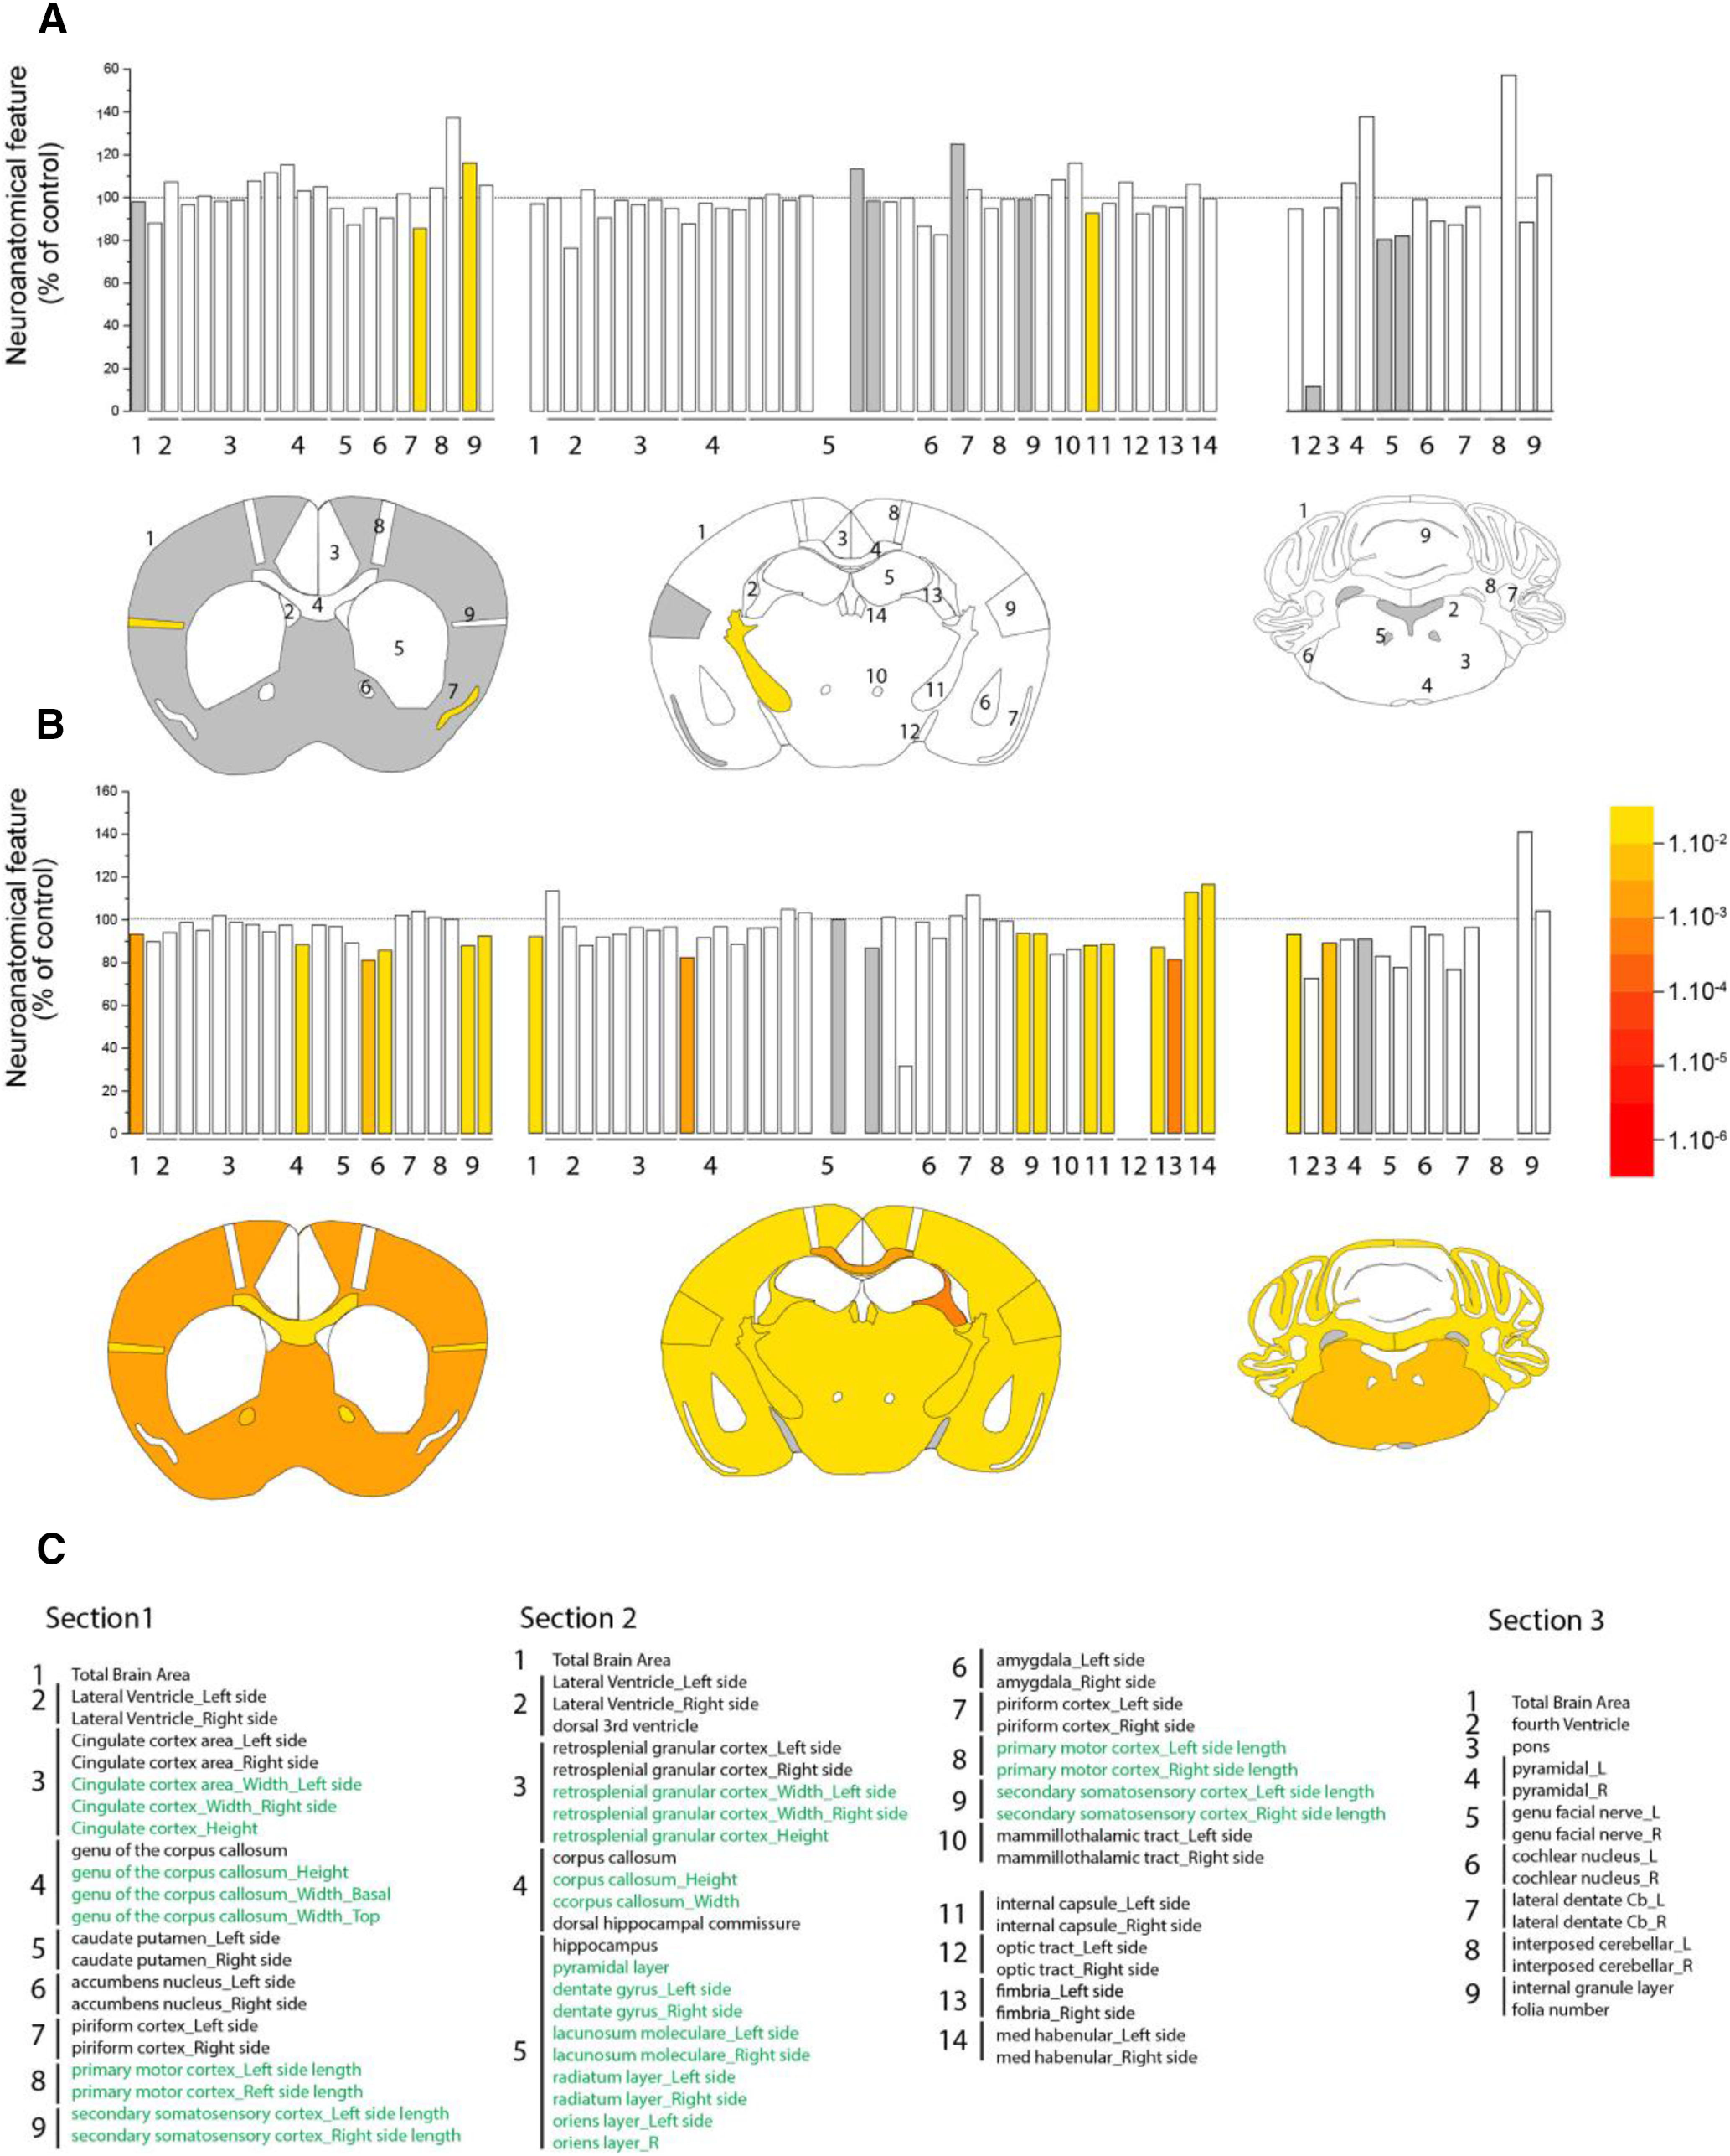
Figure 7.

Neuroanatomical alterations in SCA7 mice. The figure summarizes systematic surface measurement of 78 anatomy parameters across 20 distinct brain subregions with a precision of 30 μm and down to 5 μm resolution. A, B, Top, Histograms represent the percentage increase or decrease of measured brain regions of SCA7 mice relative to the controls (100%) at 33 weeks (A) and 50 weeks (B). A, B, Bottom, Schematic representation of affected brain regions plotted in coronal planes according to p values in SCA7140Q/5Q mice versus WT littermates (5 or 6 mice per genotype). Left, Striatum section (bregma 0.98 mm). Middle, Hippocampus section (bregma −1.34 mm). Right, Cerebellum section (bregma −5.80 mm). White represents a p value >0.05. Gray represents missing data. Numbers indicate a total of 78 assessed brain regions (listed in C). C, List of assessed parameters and associated numbers across the three coronal sections. Green represents a length measurement. Black represents an area measurement. At 33 weeks (A), there is no major surface difference between SCA7140Q/5Q mice and WT littermates. At 50 weeks (B), the three coronal sections of SCA7 mouse brain show striking reduction (section 1: −6.7%, p = 0.0017; section 2: −8.1%, p = 0.0145; section 3: −7%, p = 0.0238) with both white and gray matter atrophy. Affected white matter regions include the corpus callosum (section 1: −11.6%, p = 0.0226; section 2: −17.8%, p = 0.0049, for the area of the soma of the corpus callosum), the anterior commissure (−17.8%, p = 0.0070, based on average of left and right hemispheres), the internal capsule (−11.9%, p = 0.0099, based on an average between the left and the right hemispheres), and the fimbria of the hippocampus (−13.9%, p = 0.0288). Altered gray matter structures are confined to the somatosensory cortex across two sections (section 1: −9.8%, p = 0.0055, based on an average between the left and the right hemispheres; section 2: −6.6%, p = 0.0004) and the pons of the cerebellum section (−10.9%, p = 0.0054). Data were analyzed using a Student's t test.
