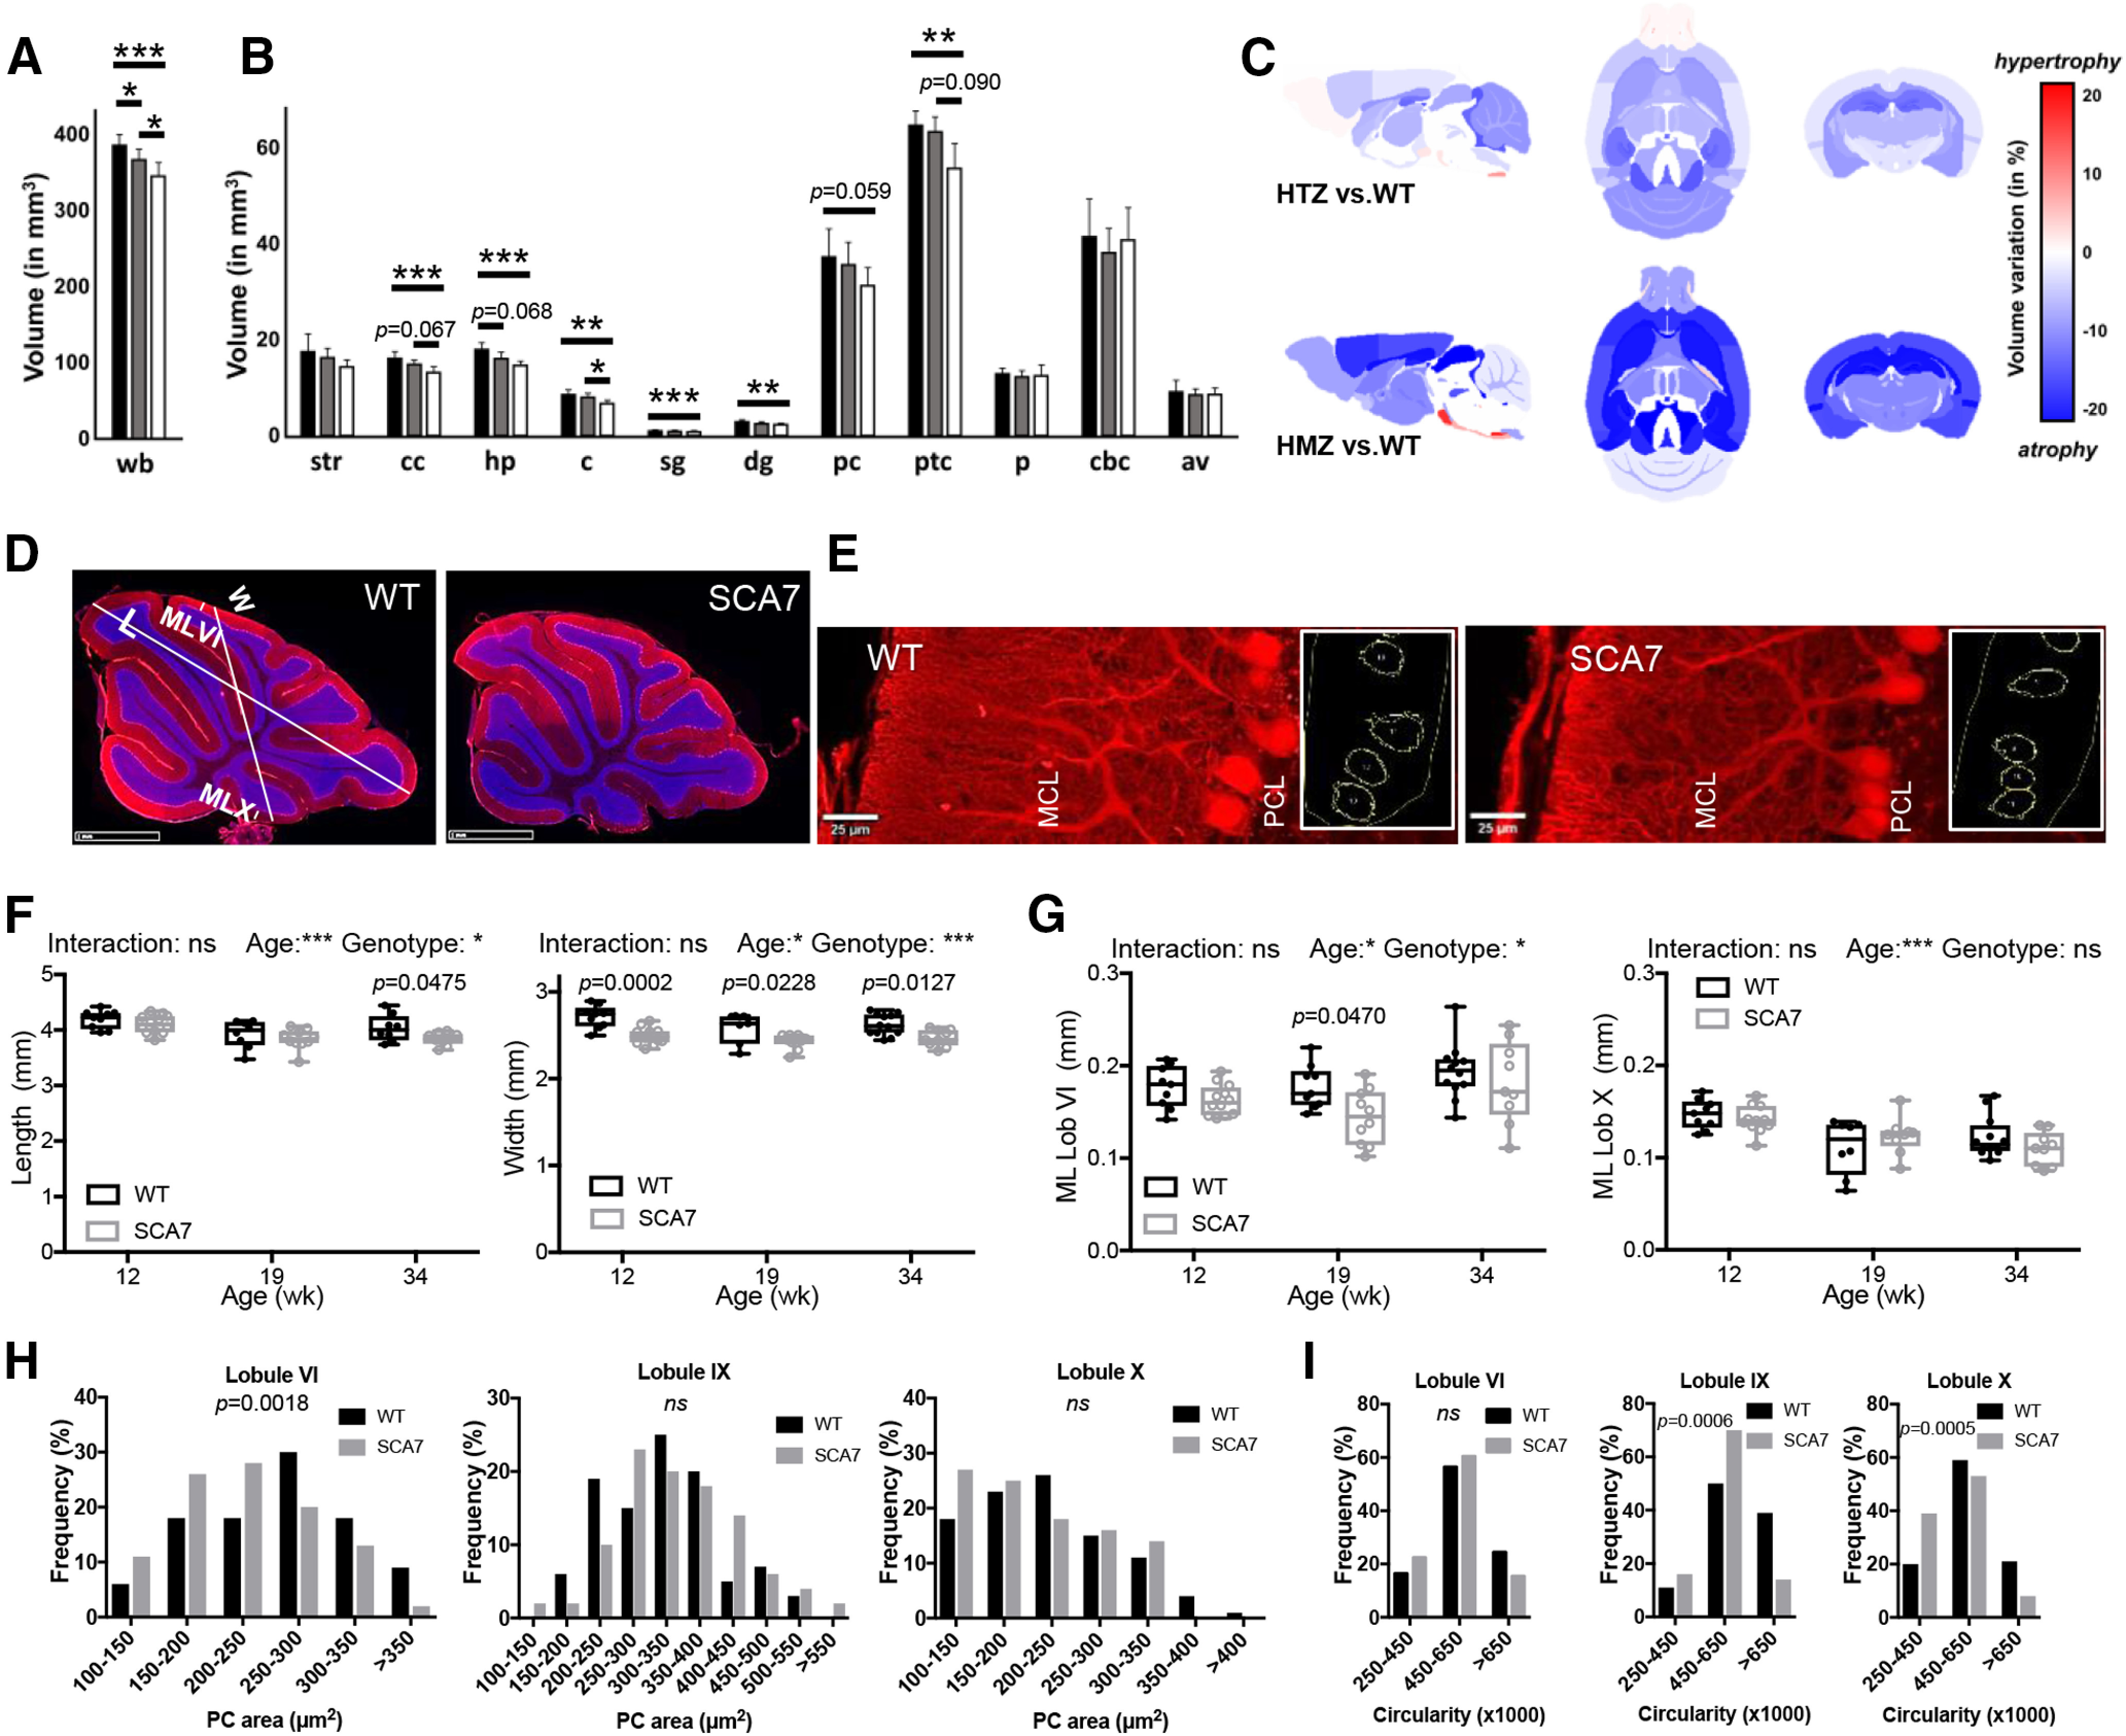
Figure 8.

Brain region atrophy and morphologic alteration of PCs in SCA7. A-C, Ex vivo MRI measurement of whole-brain volume (A) and individual brain structures (B) represents differences between WT (n = 8), SCA7140Q/5Q (n = 9), and SCA7140Q/140Q (n = 6) mice at 24 weeks (black, gray and white bars, respectively). wb, Whole brain; str, striatum; cc, corpus callosum; hp, hippocampus; c, colliculus; sg, stratum granulosum; dg, dentate gyrus; pc, prefrontal cortex; ptc, parietotemporal cortex; p, pons; cbc, cerebellar cortex; av, arbor vitae. A, B, Data are mean ± SEM. *p < 0.05; **p < 0.01; ***p < 0.001; one-way ANOVA with post hoc Bonferroni test. Variation maps (C) of brain structure volumes of MRI that compare WT versus SCA7140Q/5Q heterozygous (HTZ) mice (top) and WT versus SCA7140Q/140Q homozygous (HMZ) mice (bottom). Variation of brain region volume was calculated in each ROI as follows: Variation = 100 × [Volume(SCA7) – Volume(WT))/Volume(WT)]. Statistical analysis was performed by a nonparametric Kruskal–Wallis test with correction for multiple comparisons. Probability levels are indicated above vertical bars when trends of difference between groups are observed. D, E, CALB 1 immunostaining (red) of cerebellar vermis section (D) and PCs (E) in lobule VI of the vermis of WT and SCA7 mice (DAPI in blue). Axis from lobule V to IX and axis from lobule VI to X in D are used to measure the vermis length (L) and vermis width (W). The CALB 1 staining in E is used to evaluate the PC soma size and circularity (right). PCL, PC layer. Scale bar, 20 µm. F, Longitudinal analysis of the cerebellar vermis length shows shortening at late disease stage (34 weeks) in SCA7140Q/5Q relative to WT mice, while the width has reduced size from 12 weeks onward in SCA7140Q/5Q mice (n = 8-12 tissue sections/age-genotype). G, Longitudinal analysis of the thickness of molecular layer (ML) of lobules (Lob) VI and X of cerebellar vermis sections shows no steady difference between SCA7140Q/5Q and WT mice (9-12 sections/mouse). F, G, Data points illustrated with interleaved box and whiskers represent minimal and maximal values. Ordinary two-way ANOVA with post hoc Bonferroni test. H, I, Frequency of PC soma area (H) and frequency of PC circularity index (I) as measured in lobules VI, IX, and X of the vermis of 34-week-old WT (n = 3) and SCA7140Q/5Q mice (n = 3) (33-51 PC/lobule/mouse were measured). SCA7140Q/5Q mice show different distribution of PC area in lobule VI and different distribution of PC circularity in lobules IX and X, relative to WT mice. Statistical analysis was performed using χ2.
