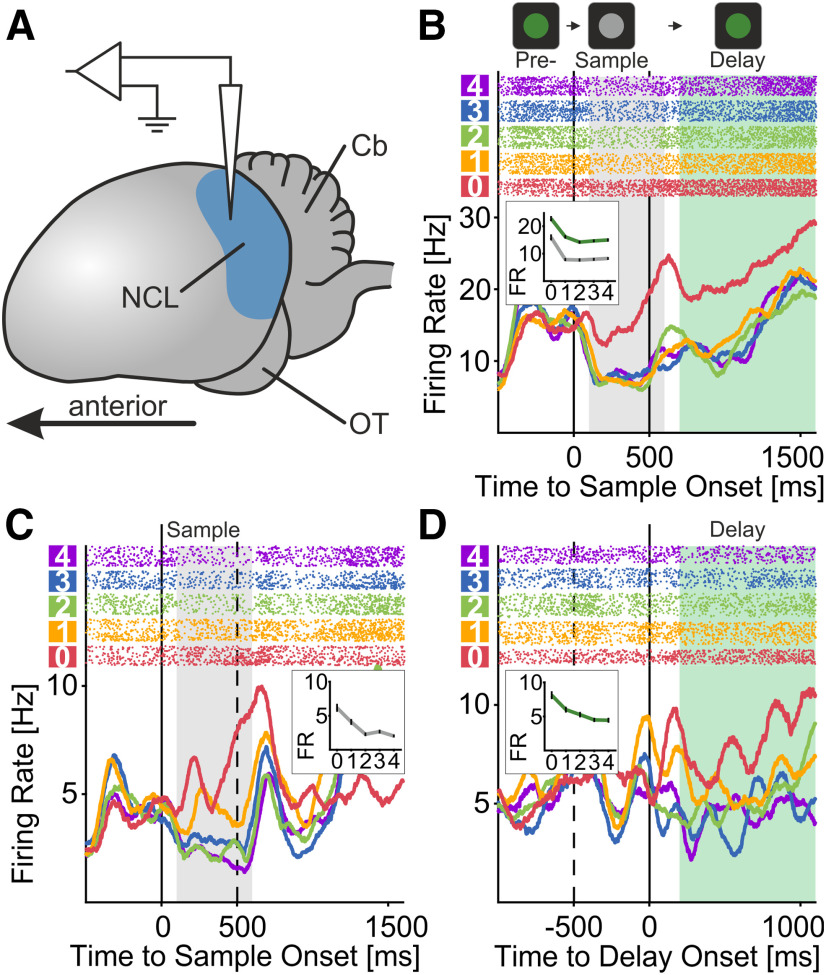
Figure 3.
Empty set neurons response to numerosity. A, Lateral view on schematized crow brain. Blue shaded depicts the recording site of both animals, the left NCL inside of the telencephalon. Cb, cerebellum; OT, optic tectum. B–D, Exemplary single units preferring empty set stimulus over all other countable numerosities (1–4). Top panels show dot-raster histograms (each dot representing one action potential), bottom panels show smoothed spike-density functions (smoothed with a 150-ms Gaussian kernel). The colors of dots and spike density functions correspond to the numerosity of the sample stimulus. The insets within the bottom panels show the tuning functions of the cells, averaged over time within the shaded areas (gray for sample; green for delay). Error bars show the SEM. These shaded areas also correspond to the time-windows used for all analysis of activity for the respective task period. The unit in C responds maximally to empty set stimuli during the sample period, whereas neuron (D) does so during the memory delay. The cell in B prefers empty set in both, sample and delay period.

