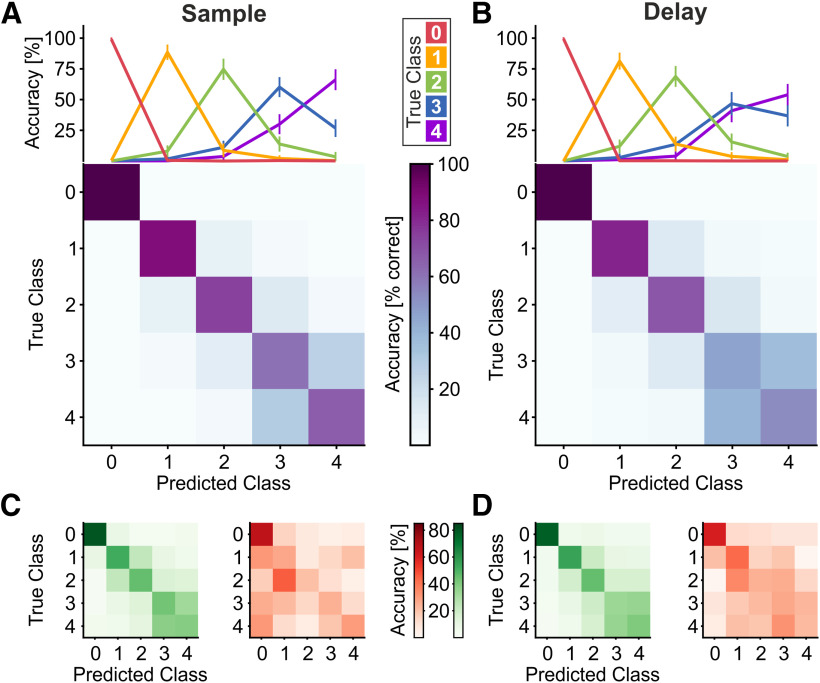
Figure 5.
Population decoding and behavioral relevance. A, B, SVM classifier's performance, cross-validated within sample (A) or delay (B) period. Top panels show classification performance for each true class (that is, sample numerosity). Error bars show the SEM. Bottom panels depict the confusion matrices (averaged over 10-fold cross-validation and 100 resamples). Rows within the confusion matrices correspond to the classification performance curves. C, D, Confusion matrices for SVM prediction of either correct (left, green) or error trials (right, red), during sample (C) or delay (D) period. The scaling of colormaps is the same across both task periods. Color values in the confusion matrices show the average over cross-validation runs (see Materials and Methods) and resamples.

