
Figure 6.
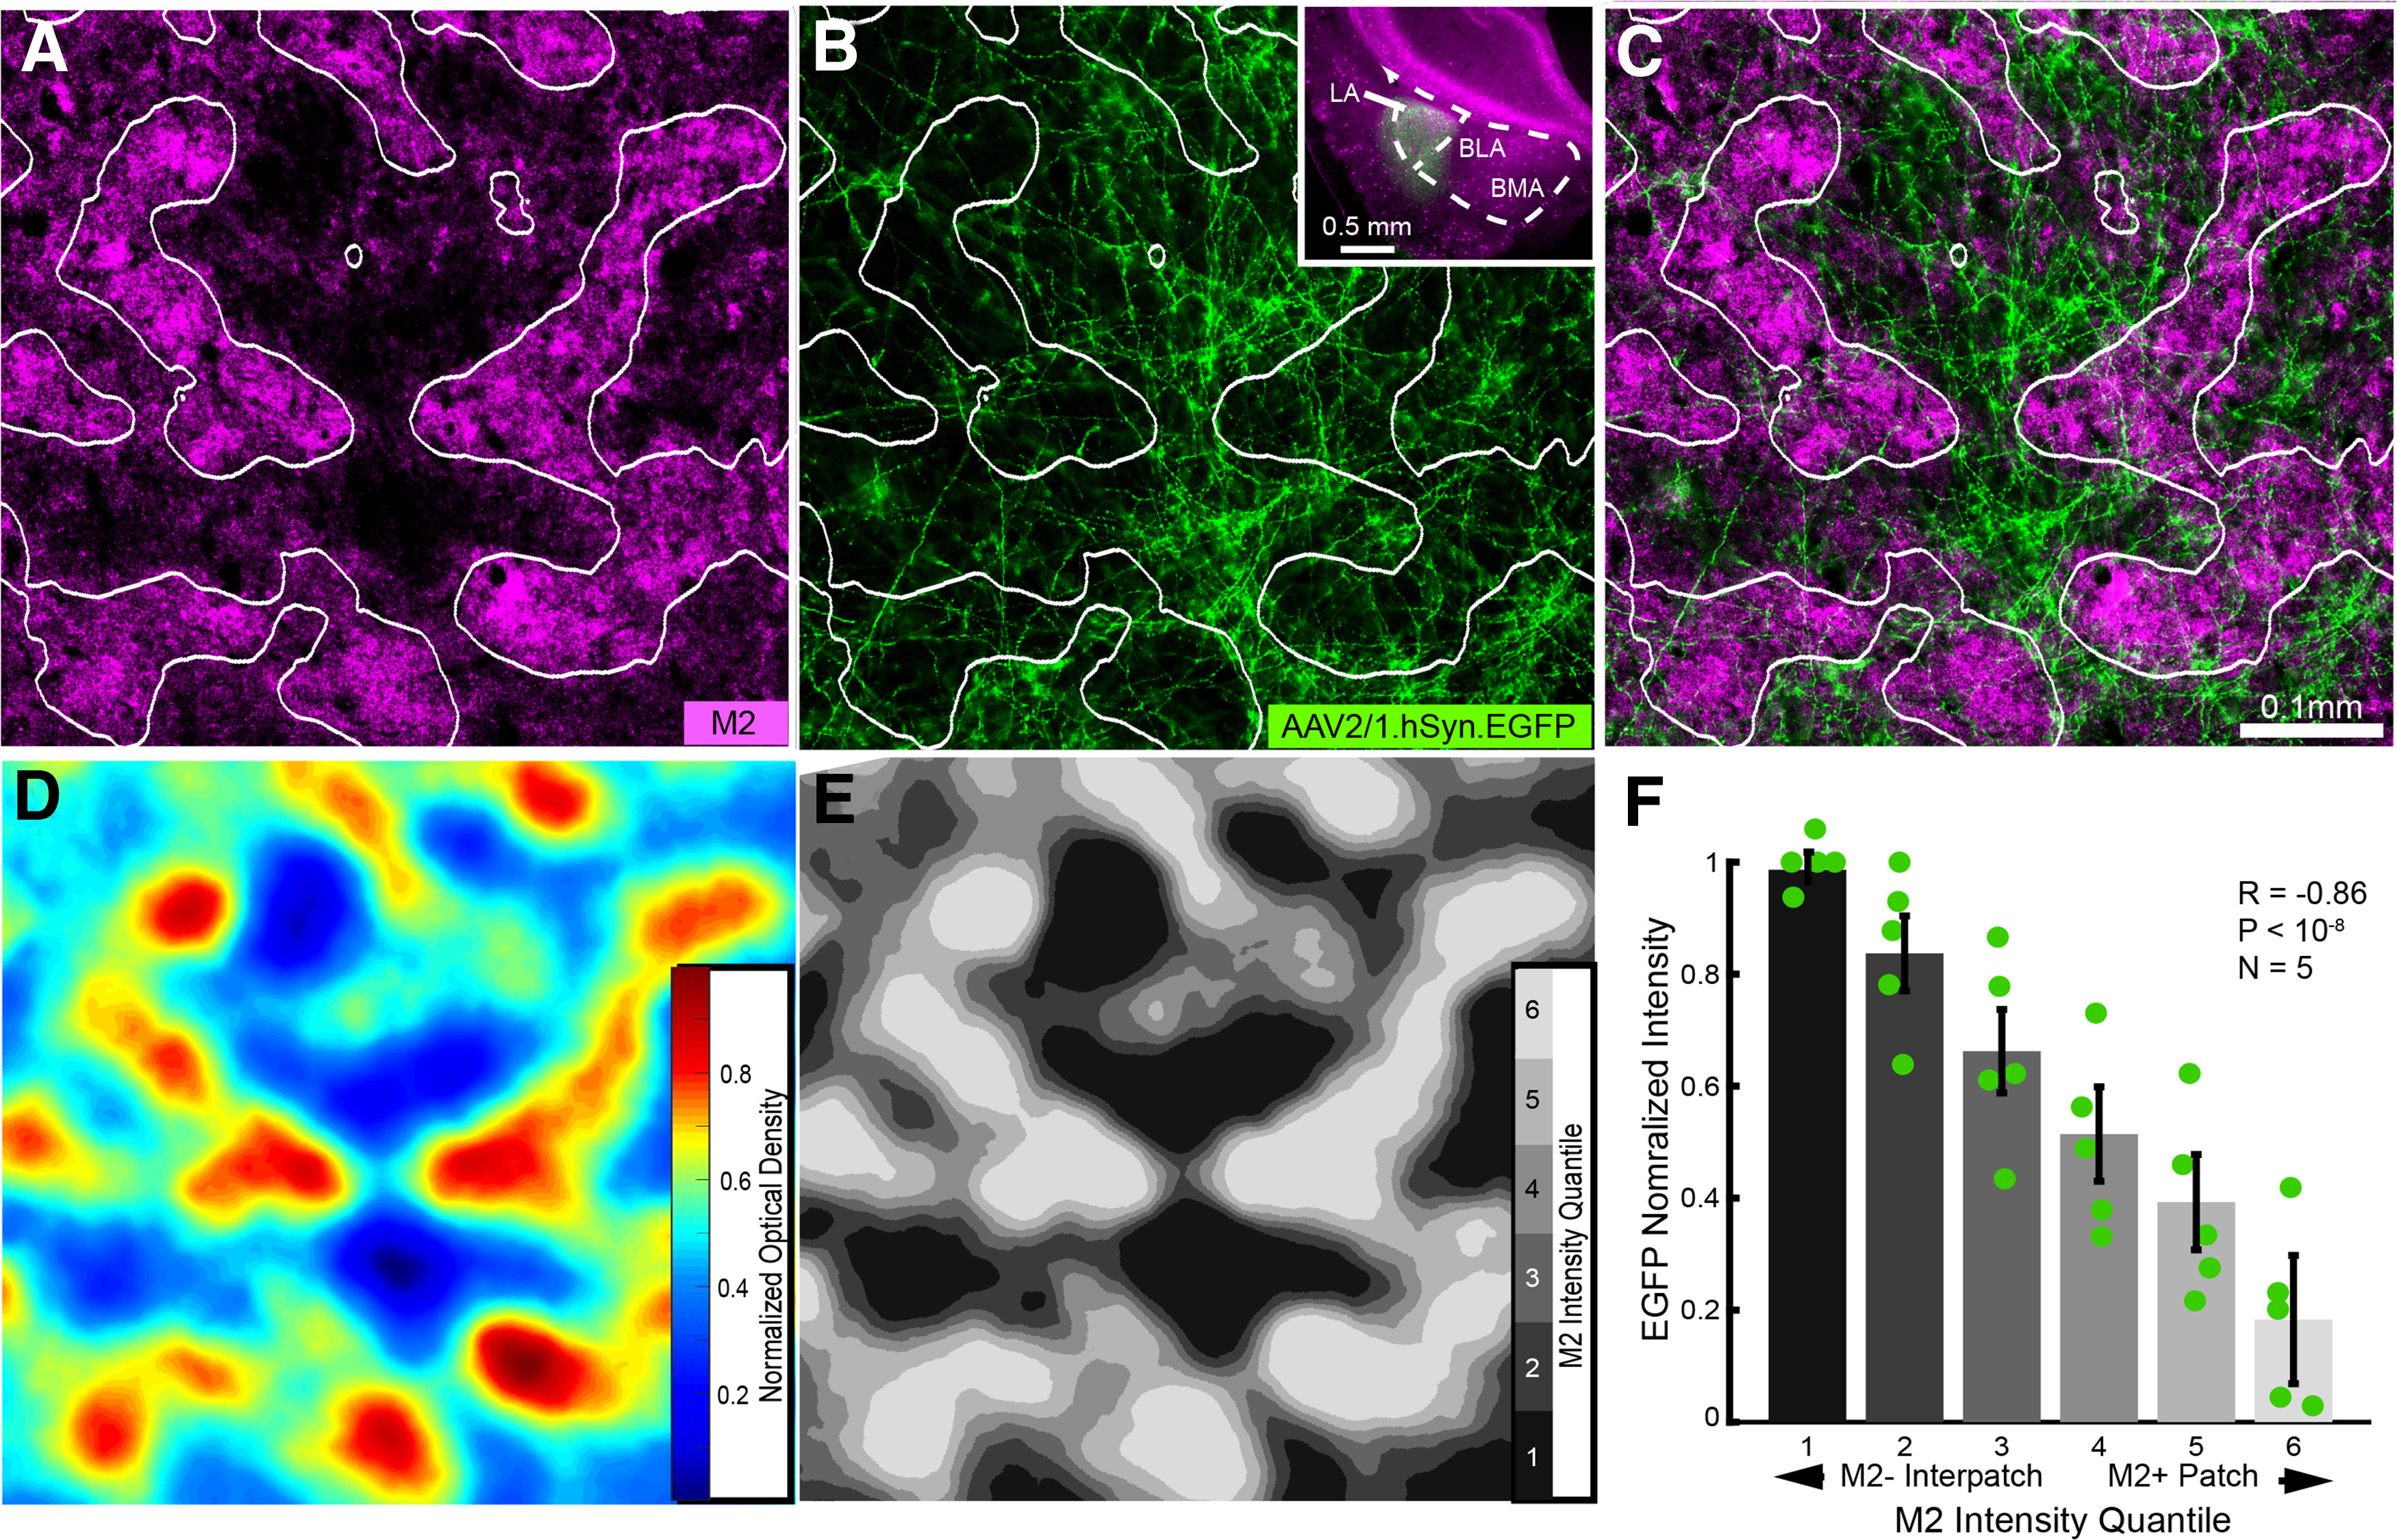
Axonal projections of lateral amygdala → POR pathway. A, Tangential section through L1 of flatmounted POR in Chrm2-tdT mouse showing nonuniform pattern of M2+ patches (magenta) and M2– interpatches (black). B, Patchy axonal projections to L1 labeled by anterograde tracing with AAV2/1.hSyn.EGFP from the LA. Coronal section of injection site in LA (B, inset). C, Overlay of A and B shows that LA → POR projection to L1 terminates preferentially in M2– interpatches. D, Heat map of M2 expression in POR (A). E, Partitioning of heat map (D) into six equal-area quantiles (different shades of gray) for the delineation of M2+ patches and M2– interpatches. F, Normalized average ± SEM (N = 5 mice) EGFP fluorescence intensity in each of the six quantiles shows that LA → POR inputs are preferentially associated with M2– interpatches (R = −0.86, p < 10−8, Pearson correlation).