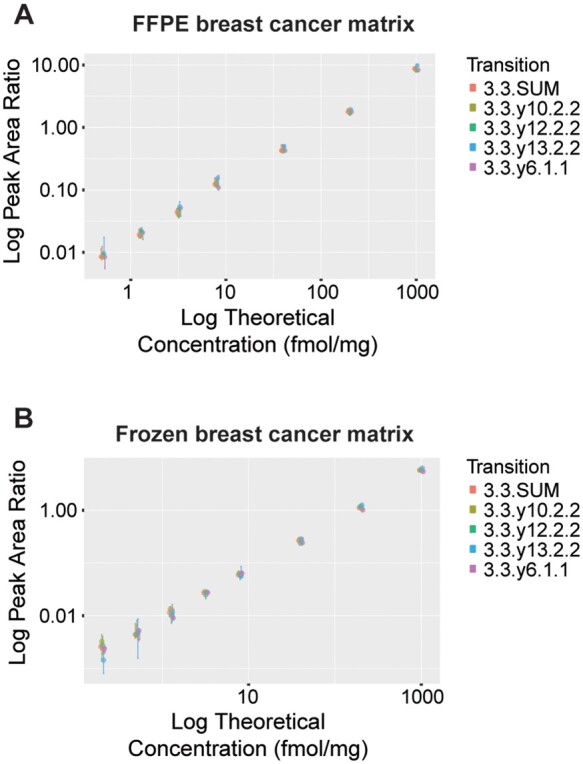
Fig. 2.

The assay targeting the HER2 peptide GLQSLPTHDPSPLQR was characterized by response curves. Response curves consist of 8 concentration points, covering almost 4 orders of magnitude, in (A), formalin-fixed paraffin-embedded (FFPE) and (B), frozen tumor tissue lysate. Error bars represent the standard deviation of the independent analysis of triplicate process replicates.
