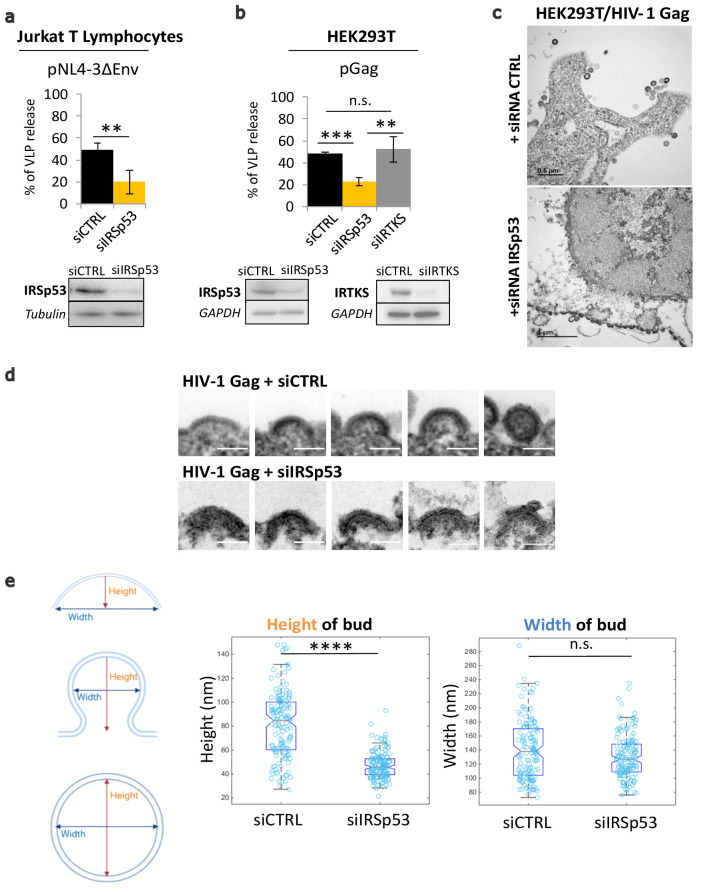
Figure 1. Partial knockdown of IRSp53 decreases HIV-1 Gag particle release by arresting assembly at the cell plasma membrane.
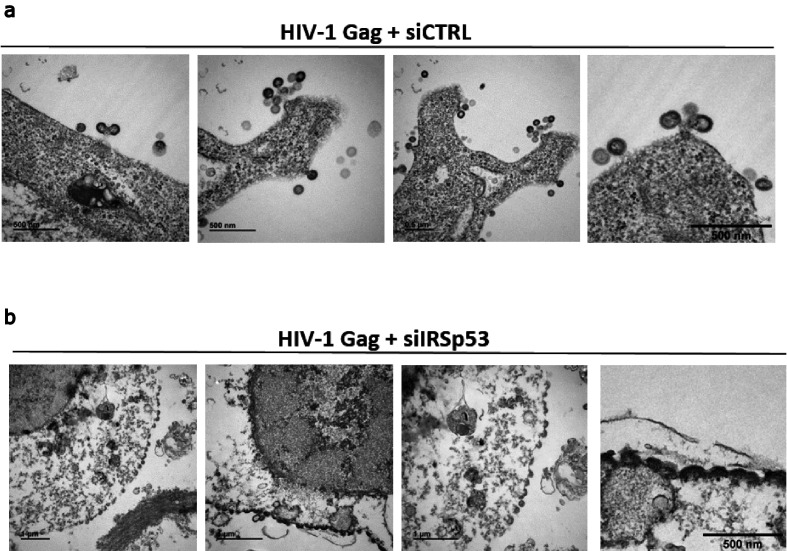
(a) siRNA knockdown of IRSp53 expression in Jurkat T lymphocytes leads to a significant decrease in pNL4-3ΔEnv Gag particle release (see graph and immunoblots for IRSp53, p = 0.00265, Student’s t-test, and loading controls beneath the graph). (b) Similarly, knockdown of IRSp53 expression in Gag expressing HEK293T cells led to a significant decrease in HIV-1 Gag particle release (p = 0.00487, Student’s t-test), as compared to siRNA IRTKS (p = 0.0116, Student’s t-test). On the other hand, knockdown of IRTKS expression (a closely related I-BAR protein) did not have a significant effect on particle release (p = 0.0924, Student’s t-test, upper graph, immunoblots for IRSp53, IRTKS, and loading controls beneath the graph) (n = 3 independent experiments). Another multiple comparisons statistical test ANOVA was applied to compare the three siRNA conditions showing a significative difference with a p value = 0.0089. (c) Transmission electron microscopy images of HEK293T cells expressing HIV-1 Gag with siRNA control (upper panel) and siRNA IRSp53 (lower panel). Scale bar is 0.5 µm (upper image) and is 1 µm (lower image). (d) Transmission electron microscopy zoomed images of viral buds from HIV-1 Gag expressing cells treated with siRNA-mediated knocked down of IRSp53 (lower panel) showing arrested buds at the plasma membrane as compared to the siRNA control cells (upper panel) which display a normal range of buds in different stages of assembly and budding (scale bar = 100 nm). (e) Measurement of the bud dimensions (height and width median with interquartile) in the control siRNA and siRNA IRSp53 conditions (n = 145 buds from 14 different cells for each condition, n = 2 independent experiments). The knocked down cells exhibit a narrow range of heights corresponding to the arrested buds visible in the images, while the control cells display a wider range of heights corresponding to assembly progression (left graph, ‘Height of bud’). Distribution of the height values in the two conditions is significantly different (p = 1.05 × 10⁻²⁸, Kolmogorov-Smirnov test). On the opposite, the widths of the buds in both conditions did not display significant differences in distributions (p = 0.0609, Kolmogorov-Smirnov test).


