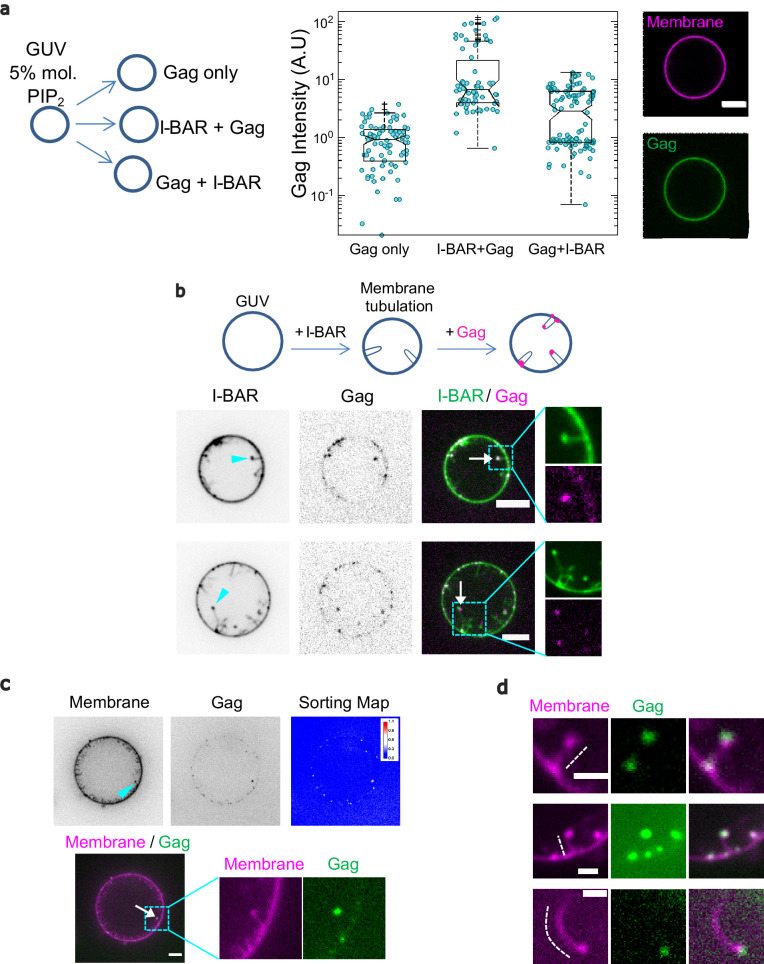
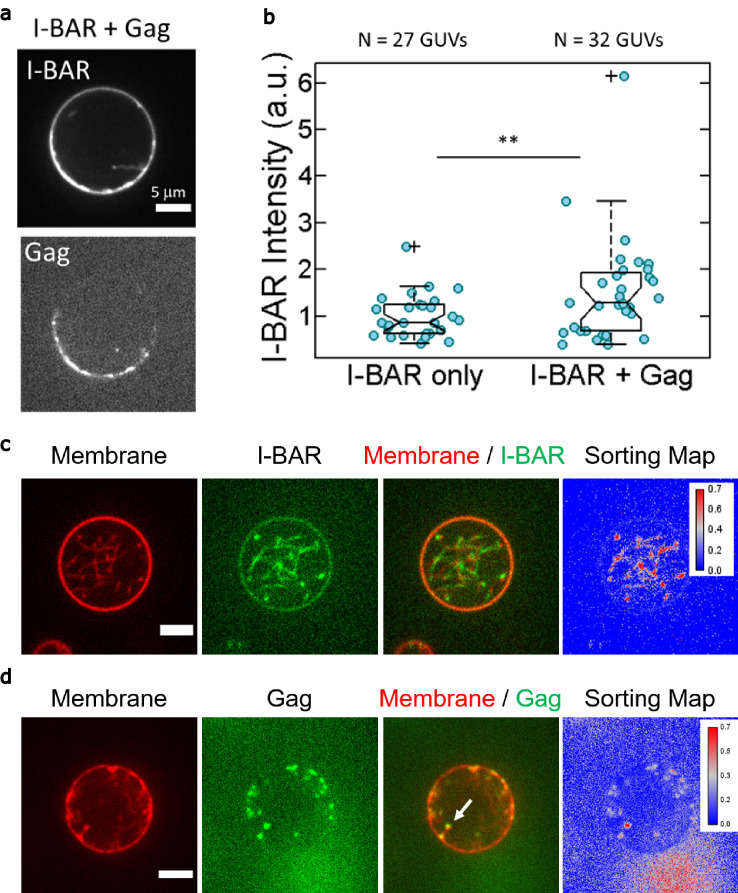
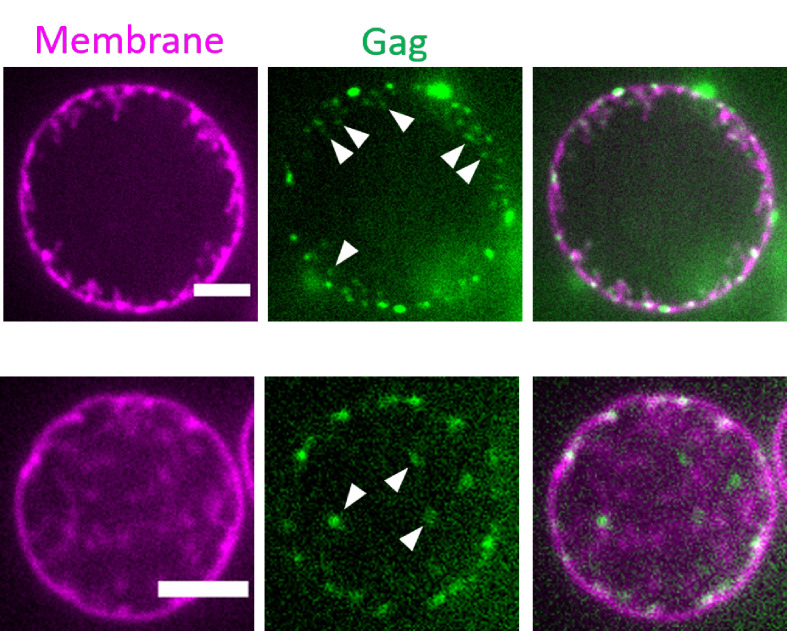
Figure 6. IRSp53 I-BAR domain enhances Gag recruitment to GUV-membranes and at the tip of I-BAR domain-induced tubes.
(a) (Left) AX488 Gag fluorescence intensity on membranes in the absence of I-BAR domain (named ‘Gag only’), in the presence of I-BAR domain where GUVs were first incubated with I-BAR domain and then Gag (named ‘I-BAR + Gag’) and GUVs were first incubated with Gag and then I-BAR domain (named ‘Gag + I-BAR’). Each circle presents one GUV analysis. N = 82 GUVs, n = 4 sample preparations for ‘Gag only,’, N = 67 GUVs, n = 4 sample preparations for ‘I-BAR + Gag,’ and N = 104 GUVs, n = 4 sample preparations for ‘Gag + I-BAR’. To pool all data points from the four sample preparations, in each preparation for all three conditions, Gag intensities were normalized by the mean Gag intensity in the ‘Gag only’ condition. Protein bulk concentrations: 0.3 µM for AX488 Gag and 0.5 µM for I-BAR domain (not fluorescently labeled). (Right) Representative confocal images of AX488 Gag on GUV membranes in ‘I-BAR + Gag’ condition. To visualize GUV membranes, 0.5 mol% of BODIPY-TR-C5-ceramide was incorporated in the membranes. (b) Representative confocal images of AX594 Gag in I-BAR domain-induced tubules. Inverted grayscale images are shown for I-BAR domain and Gag. Protein bulk concentrations: 0.3 μM for AX594 Gag and 0.05 µM for I-BAR domain (70% unlabeled and 30% AX488 labeled I-BAR domain). Cyan arrowheads point out I-BAR domain-induced tubules and white arrows indicate the colocalization of Gag and I-BAR domain at the tips of the tubules. (c and d) Representative confocal images of AX488 Gag (green) in I-BAR domain-induced tubules. Protein bulk concentrations: in (c) 0.1 µM for AX488 Gag and 0.05 µM for I-BAR domain (not fluorescently labeled); in (d) 0.3 µM for AX488 Gag and 0.05 µM for I-BAR domain (not fluorescently labeled). To visualize GUV membranes, 0.5 mol% of BODIPY-TR-C5-ceramide (magenta) was incorporated in the membranes. In (c), inverted grayscale images were shown for membranes and Gag. The cyan arrowhead points out an I-BAR domain-induced tubule and white arrow indicates Gag signals at the tip of the tubule. Sorting map was obtained by calculating the fluorescence intensity ratio of Gag and membranes (see Material and Methods for more details). In (d), dashed white lines indicate I-BAR domain-induced tubules. Scale bars, (a–c) 5 µm and (d) 2 μm. GUV, giant unilamellar vesicle.


