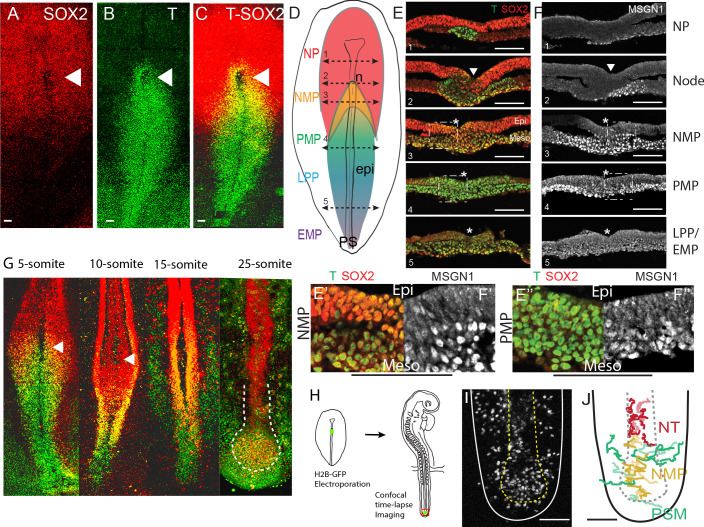
Figure 1. Characterization of the SOX2/T-positive territory of the epiblast.
(A–C) Whole-mount embryos and (E, F) transverse cryosections showing the immunolocalization of SOX2 (A), T (B), T and SOX2 (C, E), and MSGN1 (F) in chicken embryos at stage 5HH. (D) Schematic representation of the expression of T (blue: high; green: low), SOX2 (red), and SOX2/T (gold) in a stage 5HH chicken embryo. The level of the tissue sections in (E, F) is shown with dashed double arrows labeled from 1 to 5 from anterior to posterior. (E’, F’) Higher magnification of the NMP region (level 3, E, F). (E’’, F’’) Higher magnification of the PMP region (level 4, E, F). (n = 7 embryos for whole mount; n = 3 for cryosections). PS regions are defined based on distance from Hensen’s node as described in Psychoyos and Stern, 1996. (G) Maximum intensity projections from confocal images of chicken embryos immunostained for T (green) and SOX2 (red) proteins. Double-positive cells are shown in yellow. White hatched line in the 25-somite embryo marks the end of the neural tube (red) and the NMP region (orange) (n = 23 embryos analyzed in total). (H) Diagram summarizing the experimental procedure to label NMP cells in stage 5HH embryos using electroporation of a fluorescent reporter in the epiblast of the anterior PS region (in green) followed by analysis at the tail bud stage. (I, J) Fate of descendants of cells of the NMP region electroporated at stage 5HH with an H2B-RFP plasmid and imaged in time lapse at the 25-somite stage in the tail bud region. Z-projection from confocal images (I) and tracks (J) of a time-lapse movie showing the movements of the cells in the NMP territory for 10 hr (Video 1). Tracks were color-coded a posteriori. Neural, mesodermal, and NMP cell trajectories are shown in red, green, and gold, respectively. NP: neural plate; NMP: neuromesodermal progenitors; PMP: presomitic mesoderm progenitors; LPP: lateral plate progenitors; EMP: extraembryonic mesoderm progenitors; n: node; epi: epiblast; Meso: mesoderm; PS: primitive streak; NT: neural tube. Arrowheads: Hensen’s node. Asterisk: primitive streak. (A–D, G–J) Dorsal views. Anterior to the top. Scale bar: 100 µm.


