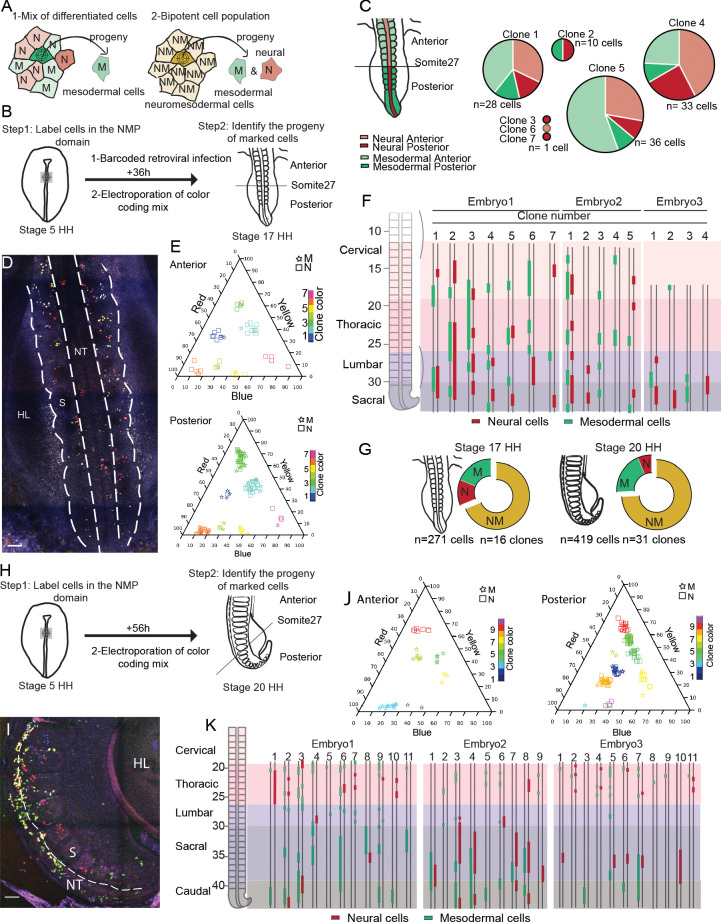
Figure 2. Cells of the SOX2/T-positive territory of the anterior primitive streak epiblast contribute to the neural tube and paraxial mesoderm tissues during axis formation.
(A) Schematic diagram showing the strategy used to decipher if the neuromesodermal progenitor (NMP) territory is a mix of monopotent cells (left) or composed of bipotent cells (right). Schemes show an example of a cell that has been marked by retroviral barcoding or genetic color coding and its expected outcome in the different cases (arrows). The color indicates the neural (red, N), the mesodermal (green, M), and the neuromesodermal (gold, NM) identities. (B) Experimental procedure showing the infected or electroporated region of the epiblast at stage 5HH (left, green) and the stage at which embryos were harvested for analysis (n = 3). (C) (left) Diagram showing the neural tube (red) and paraxial mesoderm (green) in the anterior (light) and posterior (dark) regions of the embryo. (Right) Pie graphs showing the distribution of the neural (red) and mesodermal (green) cells anterior (light) or posterior (dark) to the 27th somite in the seven clones identified by retrovirus labeling analyzed (n = 110 cells in three embryos). (D) Confocal z-section showing the region of a stage 17HH embryo shown in (H) and acquired using three separated laser paths to retrieve the color codes genetically encoded as described in Loulier et al., 2014. (E) Triplot diagrams showing the distribution of descendants of cells labeled with different Nucbow combinations in the anterior (top) and posterior (bottom) regions of seven clones in a representative stage 17HH embryo. Each symbol represents a cell identified based on the percentage of red, blue, and yellow expressed. The symbols are colored based on their clonal identity. Squares: neural cells; stars: mesodermal cells. (F) (left) Region analyzed showing the different axial levels. (Right) Axial distribution of the clones in three-stage 17HH embryos. Red bars: neural cells; green bars: mesodermal cells. (G) Quantification of the different clones: mesodermal (M, green), neural (N, red), and bipotent neuromesodermal clones (NM, gold) at stage 17HH (left) and stage 20HH (right) (n = 16 clones, 271 cells in three embryos) and (n = 40 clones, 519 cells in three embryos), respectively. (H) Experimental procedure showing the electroporated region of the epiblast at stage 5HH (left, green) and the stage at which embryos were harvested for analysis (n = 3). (I) Confocal z-section using three-color imaging (Loulier et al., 2014) corresponding to the posterior region of a stage 20HH embryo shown in (H). (J) Triplots showing the distribution of 10 representative clones in the anterior (left) and posterior (right) regions of a stage 20HH embryo electroporated at stage 5HH. Squares: neural cells; stars: mesodermal cells. (K) (left) Region analyzed showing the different axial levels. (Right) Axial distribution of the clones in three embryos. Green bars: mesodermal cells; red bars: neural cells, double line: anteroposterior axis. M: mesoderm; N: neural; NM: neuromesodermal; S: somite; HL: hindlimb; D: dorsal views. Anterior to the top. Scale bar: 100 µm.
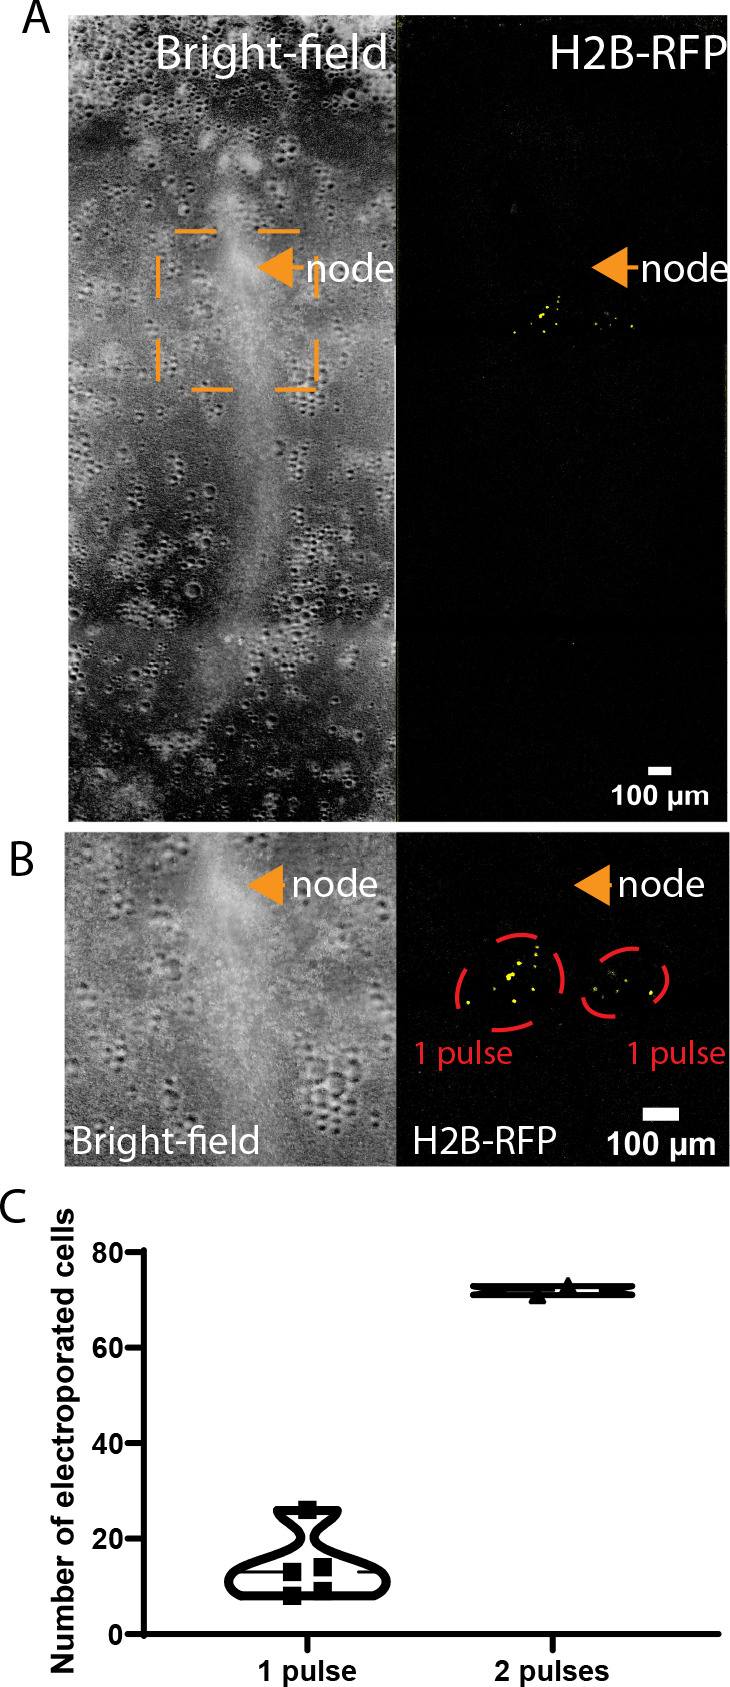
Figure 2—figure supplement 1. Quantification of the number of epiblast cells electroporated.


