. 2021 Jul 6;10:e64819. doi: 10.7554/eLife.64819

Figure 3. Single-cell RNA-sequencing (scRNAseq) analysis of the posterior tissue precursors during posterior axis formation.

(A–C) (left) Diagrams of a stage 5HH (A), a 6-somite (B), and a 35-somite (C) chicken embryo showing the region dissected and analyzed by scRNAseq in the hatched red boxes, which includes the NMP territory (in gold). (Right) k-NN graph showing the 2059 cells sequenced from stage 5HH embryos (A), the 1628 cells sequenced from 6-somite embryos (B), and the 3561 cells sequenced from 35-somite embryos (C) visualized with Uniform Manifold Approximation and Projection (UMAP). Single cells are colored based on Leiden clustering identities. (D) Dotplot showing the expression level of NMP signature genes in the chicken neural, NMP, and PSM clusters. (E–G) k-NN graphs combining all sequenced cells from stage 5HH, 6-somite and 35-somite chicken embryos (total: 7992 cells), visualized with UMAP and colored following Leiden clustering to show cell identities (E), or by developmental stage (F) or to show cells of the neural, NMP, PSM, and somite clusters (in red), which were used for the subsequent analysis shown in (H–J). Note that cells in the tan color belong to different cluster identities with less than 50 cells, and we decided to show them to represent the entirety of the data but do not analyze them in our study. (H–J) k-NN graphs showing cells of the chicken neural, NMP, PSM, and somite clusters extracted based on the analysis shown in (E–G) (total: 2801 cells) from stage 5HH, 6-somite, and 35-somite visualized with diffusion map (diffmap) and analyzed using Leiden clustering to show cell identities that include neural, NMP, PSM, and somite (H), as well as the developmental stage (I) or pseudo-temporal ordering with the NMP cluster as the starting node (J). (K–M) k-NN graphs showing cells of the mouse neural, NMP, and PSM clusters extracted based on the analysis shown in Figure 3—figure supplement 3 (total: 27,083 cells) from stage E7.0–E9.5 visualized with diffusion map (diffmap) and analyzed using Leiden clustering to show cell identities that include neural, NMP, and PSM (K), as well as the developmental stage (L) or pseudo-temporal ordering with the NMP cluster as the starting node (M). (N) Dotplot showing the expression level of NMP signature genes in mouse in the neural, NMP, and PSM clusters. Ecto: ectoderm; Endo: endoderm; Epi: epiblast; Meso: mesoderm; LP: lateral plate; NMP: neuromesodermal progenitors; NT: neural tube; NC: notochord; PSM: presomitic mesoderm; postPS: posterior PS; SOM: somite; LP2: lateral plate 2; MG: mixed gastrulation in (D, N). Circle size shows the percentage of cells expressing the gene in the cluster. Color shows the normalized level of expression. Normalization is done by gene across the clusters.

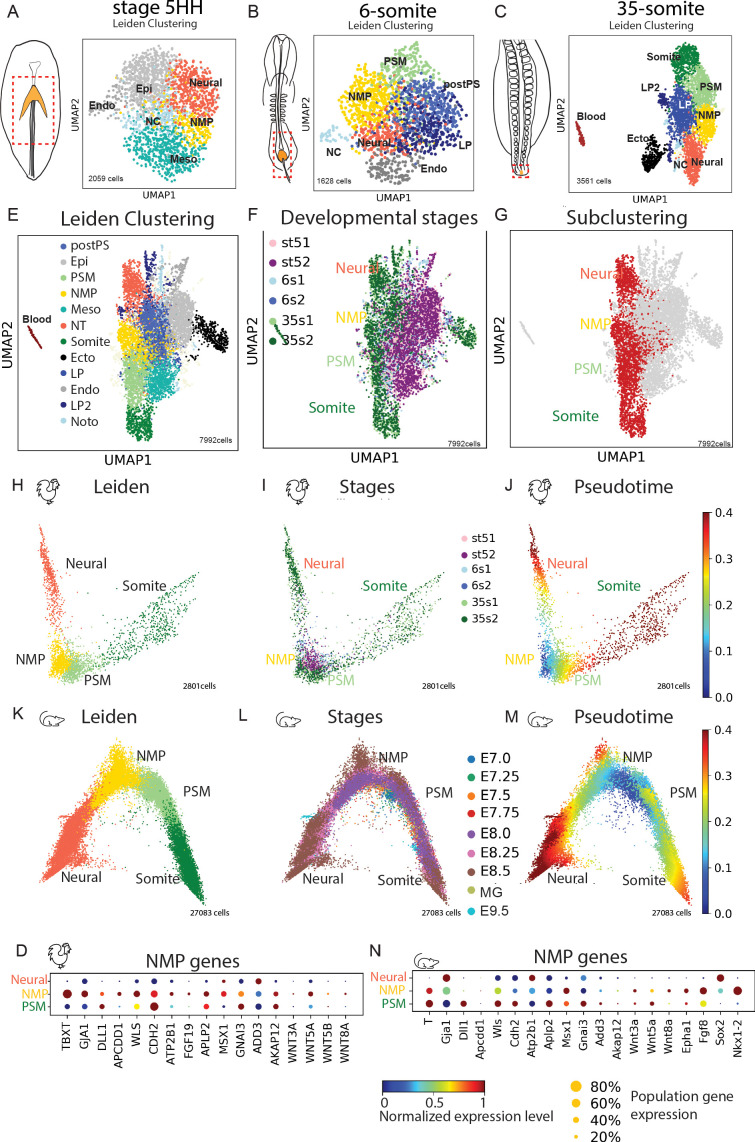
Figure 3.

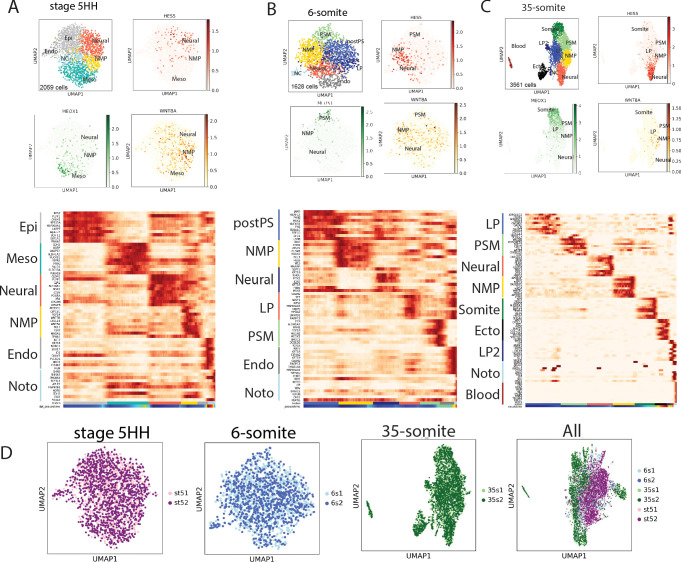
Figure 3—figure supplement 1. Single-cell RNA-sequencing (scRNAseq) analysis of stage 5HH to 35-somite chicken embryos.

Figure 3—figure supplement 1.

(A–C) Top: Uniform Manifold Approximation and Projection (UMAP) plots showing Leiden clustering of the three chicken stages analyzed and the expression of neural (HES5), mesodermal (MEOX1), and neuromesodermal (WNT8A) genes in red, green, and gold respectively. Bottom: Heat maps showing the top 10 differentially expressed genes for each clusters. (D) UMAP plots of the different batches of cells within the corresponding stages analyzed. Pink and purple (stage 5HH); light and dark blue (6-somite); light and dark green (35-somite); and a merge of all the stages (All).
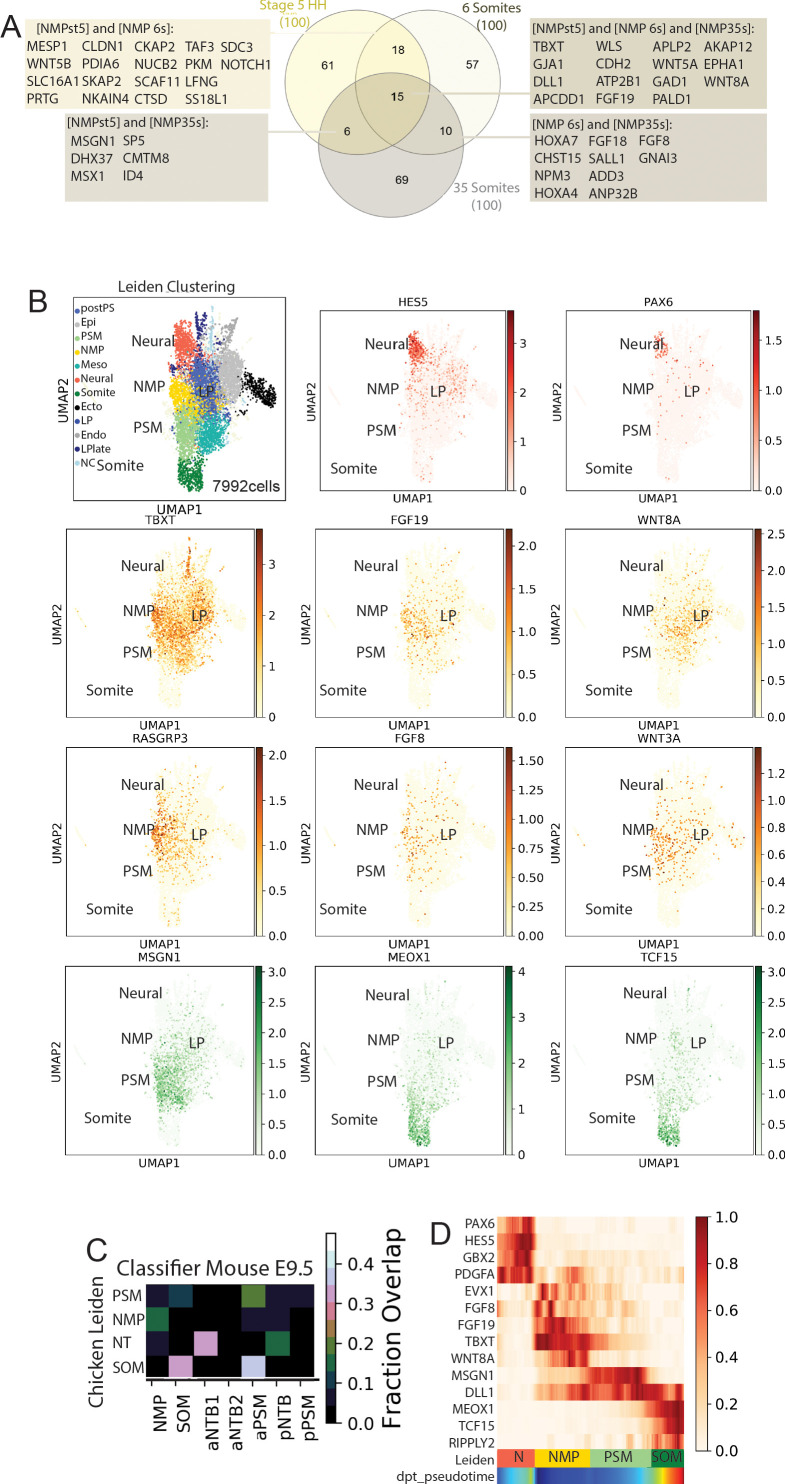
Figure 3—figure supplement 2. Analysis of combined data from stage 5HH, 6-somite, and 35-somite chicken embryos and identification of chicken neuromesodermal progenitor (NMP) signature genes.

Figure 3—figure supplement 2.

(A) Venn diagram showing the intersection of the top 100 differentially expressed genes from stage 5HH, 6-somite, and 35-somite embryos. (B) Uniform Manifold Approximation and Projection (UMAP) plots showing Leiden clustering of the data combined from the three chicken developmental stages and the expression of the neural tube (HES5, PAX6), mesodermal (MSGN1, MEOX1, TCF15), and neuromesodermal (TBXT, FGF19, WNT8A,RASGRP3, FGF8, WNT3A) genes in red, green, and gold, respectively. (C) A k-NN classifier (linear discriminant analysis [LDA]) trained on clusters of the E9.5 mouse was used to predict identities of cells of the clusters (Diaz-Cuadros et al., 2020). The heat map shows the fraction of E9.5 assignments for each cluster. SOM: somite; aNTB: anterior neural tube; pNTB: posterior neural tube; PSM: presomitic mesoderm. (D) Pseudo-temporal ordering of gene expression. Heat map showing genes with significant dynamic expression ordered by peak expression, and selected markers of the neural (N) (PAX6, HES5, GBX2, PDGFA) and paraxial mesoderm (MSGN1, DLL1, MEOX1, TCF15, RIPPLY2) differentiation from the NMP state (EVX1, FGF8, FGF19, TBXT, WNT8A). Color bars indicate Leiden cluster identities and pseudo-temporal position.
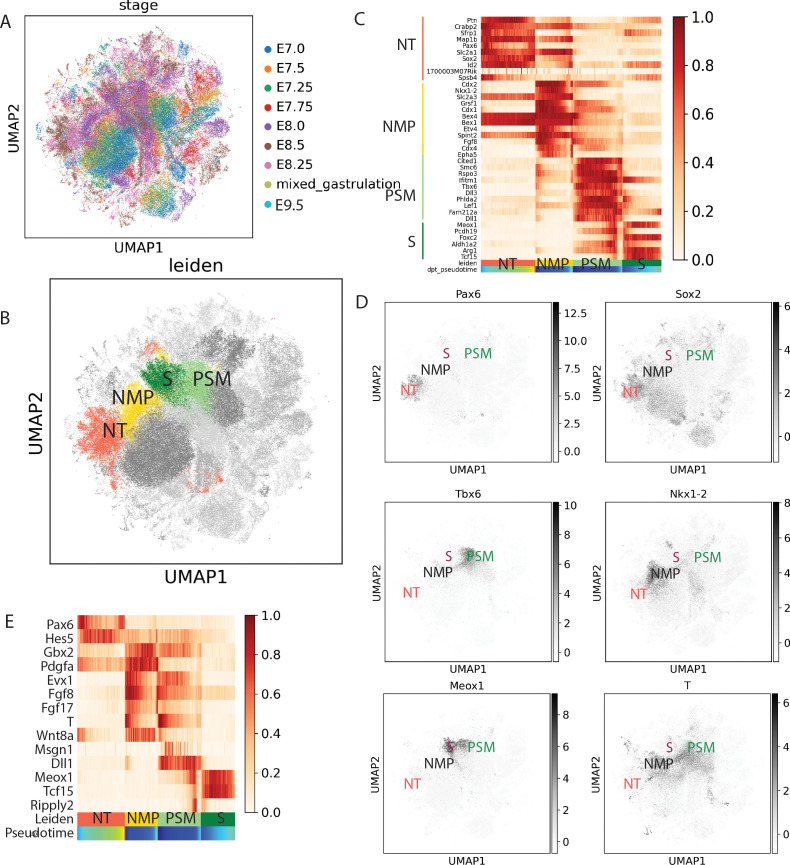
Figure 3—figure supplement 3. Analysis of combined data from E7.0 to E9.5 mouse embryos to identify the neuromesodermal progenitor (NMP), presomitic mesoderm (PSM), neural, and somite clusters.

Figure 3—figure supplement 3.

(A) Uniform Manifold Approximation and Projection (UMAP) showing the integration of the two mouse datasets (Pijuan-Sala et al., 2019 and Diaz-Cuadros et al., 2020) by stage (n = 120,679 cells), (B) Identification of the neural tube (NT), NMP, PSM, and somite (S) clusters from the dataset shown in (A) using the Leiden algorithm. (C) Expression of the genes used for identifying the NT (Pax6, Sox2), NMP (Nkx1.2, T, Sox2), PSM (T, Tbx6), and somite (Meox1) clusters identification (D). NT (red), NMP (pink), PSM (green), and somite (purple). (C) Heat map showing the top 10 differentially expressed genes for the NT, PSM, NMP, and somite clusters. (C–E) Pseudo-temporal ordering of gene expression in cells of the NMP, PSM, neural tube, and somite clusters. Heat map showing the genes with significant dynamic expression ordered by peak expression, and selected markers of the neural (Pax6, Hes5, Gbx2, Pdgfa) and paraxial mesoderm (Msgn1, Dll1, Meox1, Tcf15, Ripply2) differentiation from the NMP state (Evx1, Fgf8, FGF17, T, Wnt8a). Color bars indicate Leiden cluster identities and pseudo-temporal position. Neural: red; PSM: light green; somite: dark green; NMP: gold.
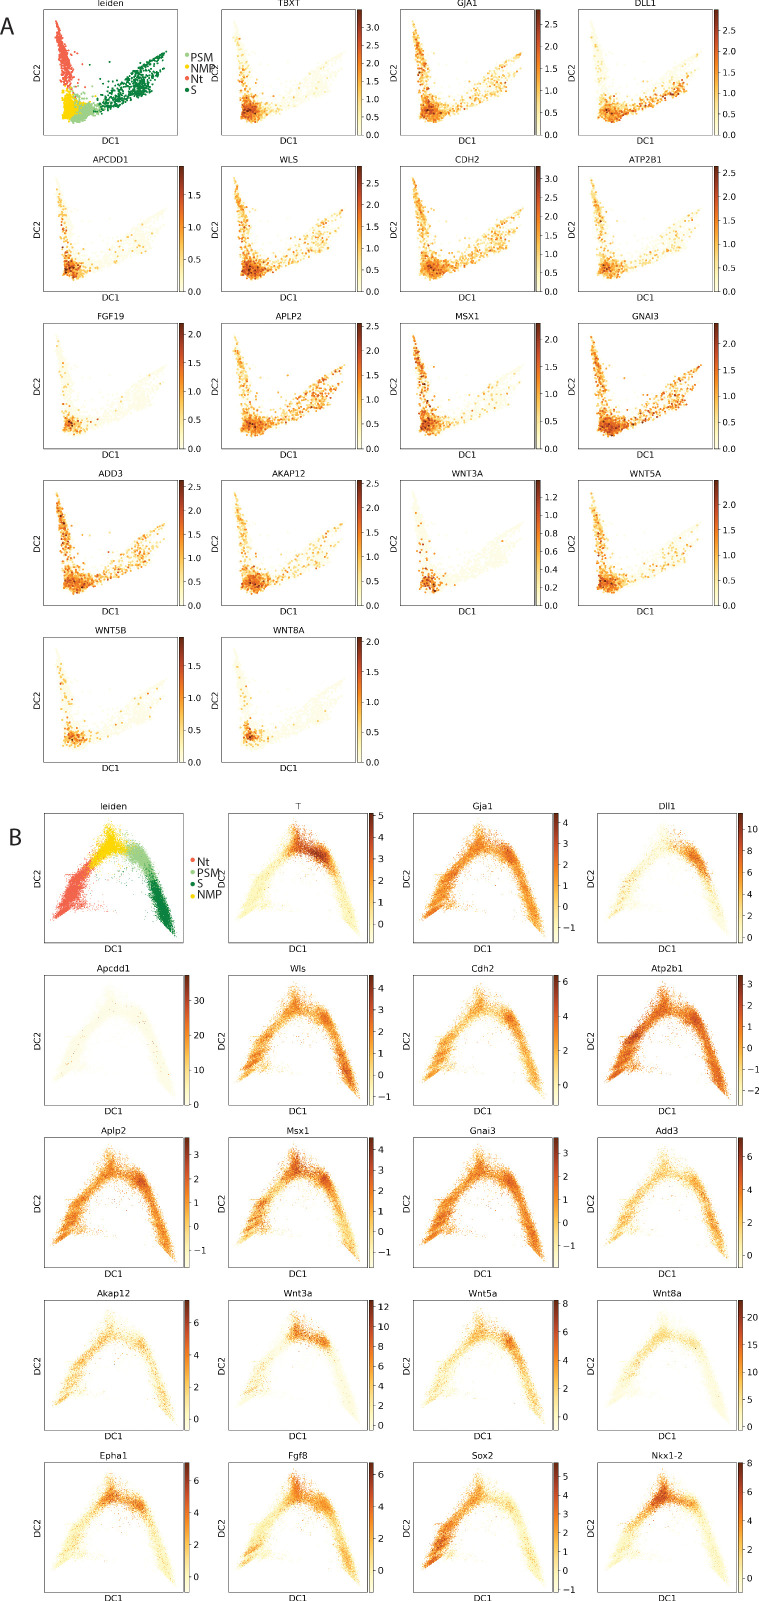
Figure 3—figure supplement 4. Expression of neuromesodermal progenitor (NMP) signature genes in chicken and mouse.

Figure 3—figure supplement 4.

(A, B) Projections of the expression of NMP signature genes on the diffmap plots (top left) of the nNeural tube (NT), NMP, presomitic mesoderm (PSM), and somite (S) clusters identified with the Leiden algorithm in chicken (A) and mouse embryos (B).