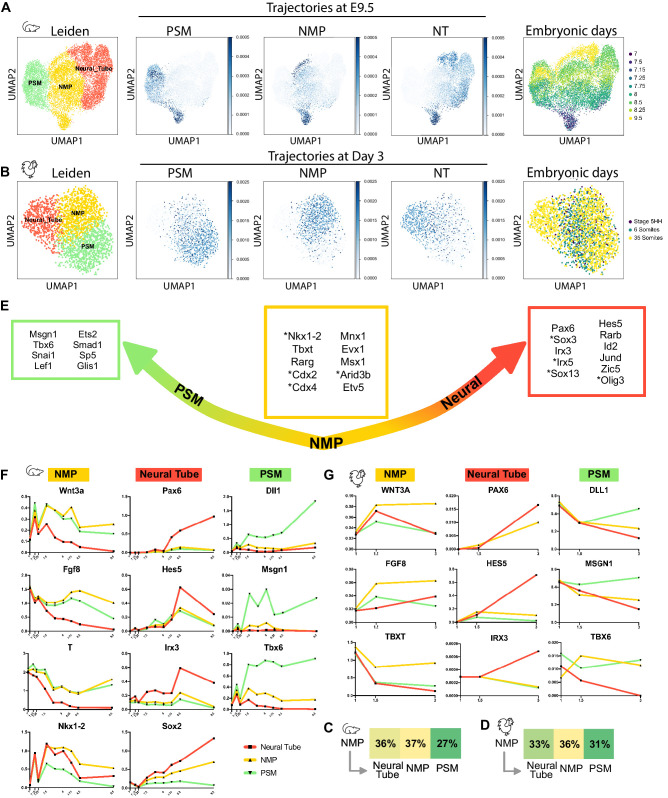
Figure 4. NMPs trajectory analysis in silico.
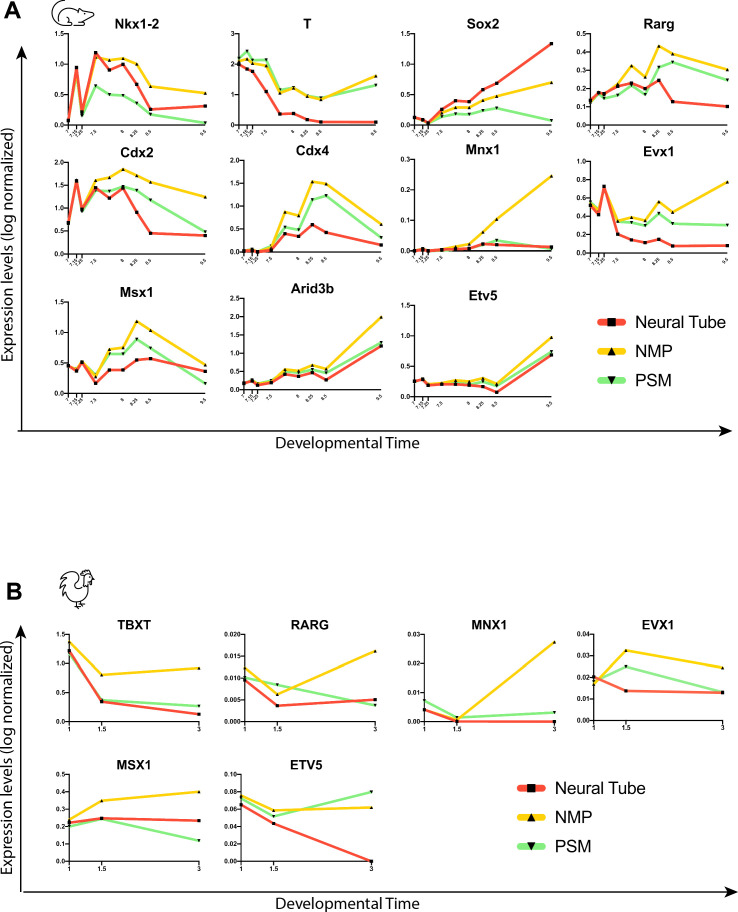
(A, B) (left) Uniform Manifold Approximation and Projection (UMAP) projection of cells of the NMP, neural, and PSM clusters, extracted from the mouse (A) and chicken (B) datasets showing the cell types identified following Leiden unsupervised clustering and differential gene-expression analysis. 2362 cells for the chicken dataset and 12072 cells for the mouse dataset. (Middle) Developmental trajectories of the cells of the NMP, PSM, and neural tube clusters at day E9.5 in the mouse dataset and stage 35 somites in the chicken dataset identified with the Waddington-OT pipeline. Optimal transport was used to infer temporal couplings in the mouse dataset at time E7, E7.15, E7.25, E7.5, 7E.75, E8, E8.5, E9, and in the chicken dataset at stage 5HH, 6 somites, 35 somites, subclustered for NMP, PSM, and neural tube. (Right) Distribution of cells by developmental age. (C, D) Transition tables representing the amount of mass transported from NMPs to the other cell types from day E7 to day E9.5 for the mouse dataset (C) and from stage 5HH to 35 somites for the chicken dataset (D). (E) Predicted transcription factors enriched in cells most likely to transition to each particular fate from day E7 to day E9.5 for the mouse dataset and from stage 5HH to 35-somites for the chicken dataset (transcription factors found in the mouse dataset but not in the chicken dataset are annotated with *). (F, G) Normalized Log gene expression of the predicted transcription factors for each cell type during axis elongation in mice (F) and chicken (G). NMP: neuromesodermal progenitors; PSM: presomitic mesoderm.


