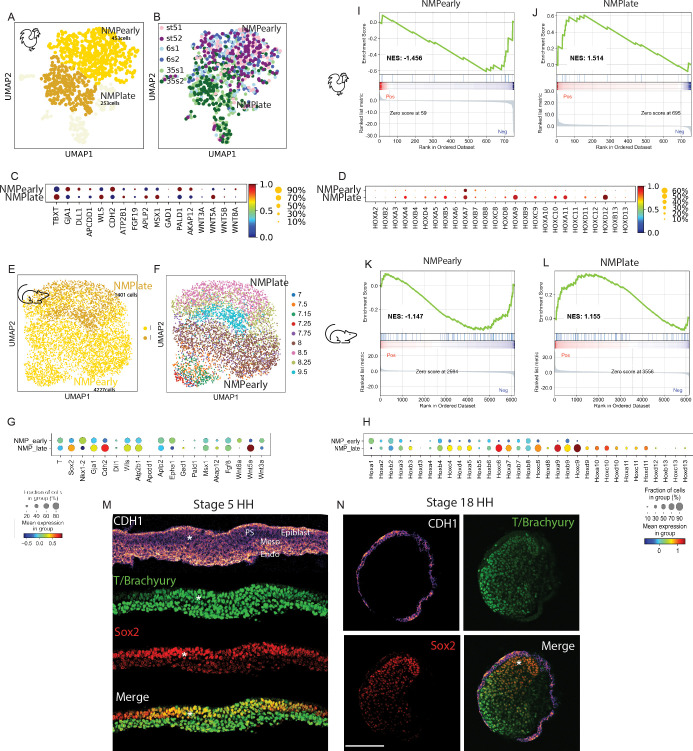
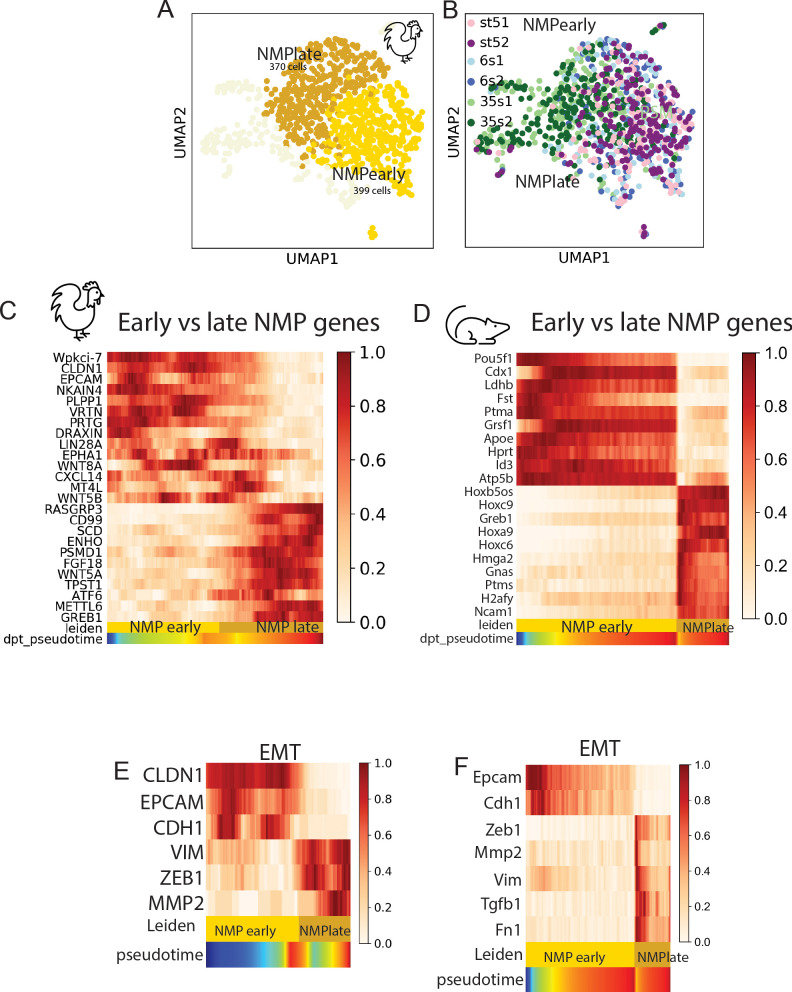
Figure 5. Downregulation of neuromesodermal progenitors’ (NMPs) epithelial phenotype during development.
(A, B) k-NN graphs showing cells of the chicken NMP cluster identified in the analysis shown in Figure 3H (total: 706 cells) from stage 5HH, 6-somite, and 35-somite visualized with Uniform Manifold Approximation and Projection (UMAP) and analyzed using Leiden clustering. Major clusters include an NMP early cluster (gold) and an NMP late cluster (goldenrod) (A). (B) Distribution of cells by developmental age. (C, D) Dotplot showing the expression levels of NMP signature (C) and HOX genes (D) in chicken NMP clusters. (E, F) k-NN graphs showing cells of the mouse NMP cluster identified in the analysis shown in Figure 3K (total: 5628 cells) from stage E7.0–E9.5, visualized with UMAP and analyzed using Leiden clustering. Major clusters include the early NMP and late NMP clusters (E). (F) Distribution of cells by developmental age. (G) Dotplot showing the expression levels of NMP signature genes in mouse NMP clusters. Note that Fgf19 is not expressed in mouse. Both Sox2 and Nkx1.2 genes are detected in mouse data and added to the dotplot. (H) Dotplot showing the expression levels of Hox genes in mouse NMP clusters. (I–L) Gene Set Enrichment Analysis (GSEA) of early NMP clusters in chicken (I) and mouse (J) and of late NMP clusters in chicken (K) and mouse (L) using the Hallmark Epithelium to Mesenchymal Transition gene set. The normalized enrichment score (NES) is based on the gene set enrichment scores and accounts for differences in gene set size and in correlations between gene sets and the expression dataset. The top portion of the plot shows the running enrichment score (ES) for the gene set as the analysis walks down the ranked list. The middle portion of the plot shows where the members of the gene set appear in the ranked list of genes. The bottom portion of the plot shows the value of the ranking metric as you move down the list of ranked genes. (M, N) Representative immunostaining of E-cadherin/CDH1, T/Brachyury, and SOX2 in cryosections of the NMP-containing anterior PS region in stage 5HH (M) and of the tail bud region of stage 18HH (N) in chicken embryos. PS: primitive streak; Endo: endoderm; Meso: mesoderm; PSM: paraxial mesoderm; Nt: neural tube. Asterisk shows the NMP domain dorsal to the top (M). D: dorsal; V: ventral and anterior to the top (N). Scale bar: 100 µm (n = 3 embryos). Circle sizes in (C, D, G, H) show the percentage of cells expressing the gene in the cluster. Color shows the normalized level of expression. Normalization is done by clusters across all the Hox genes.


