
Figure 6.
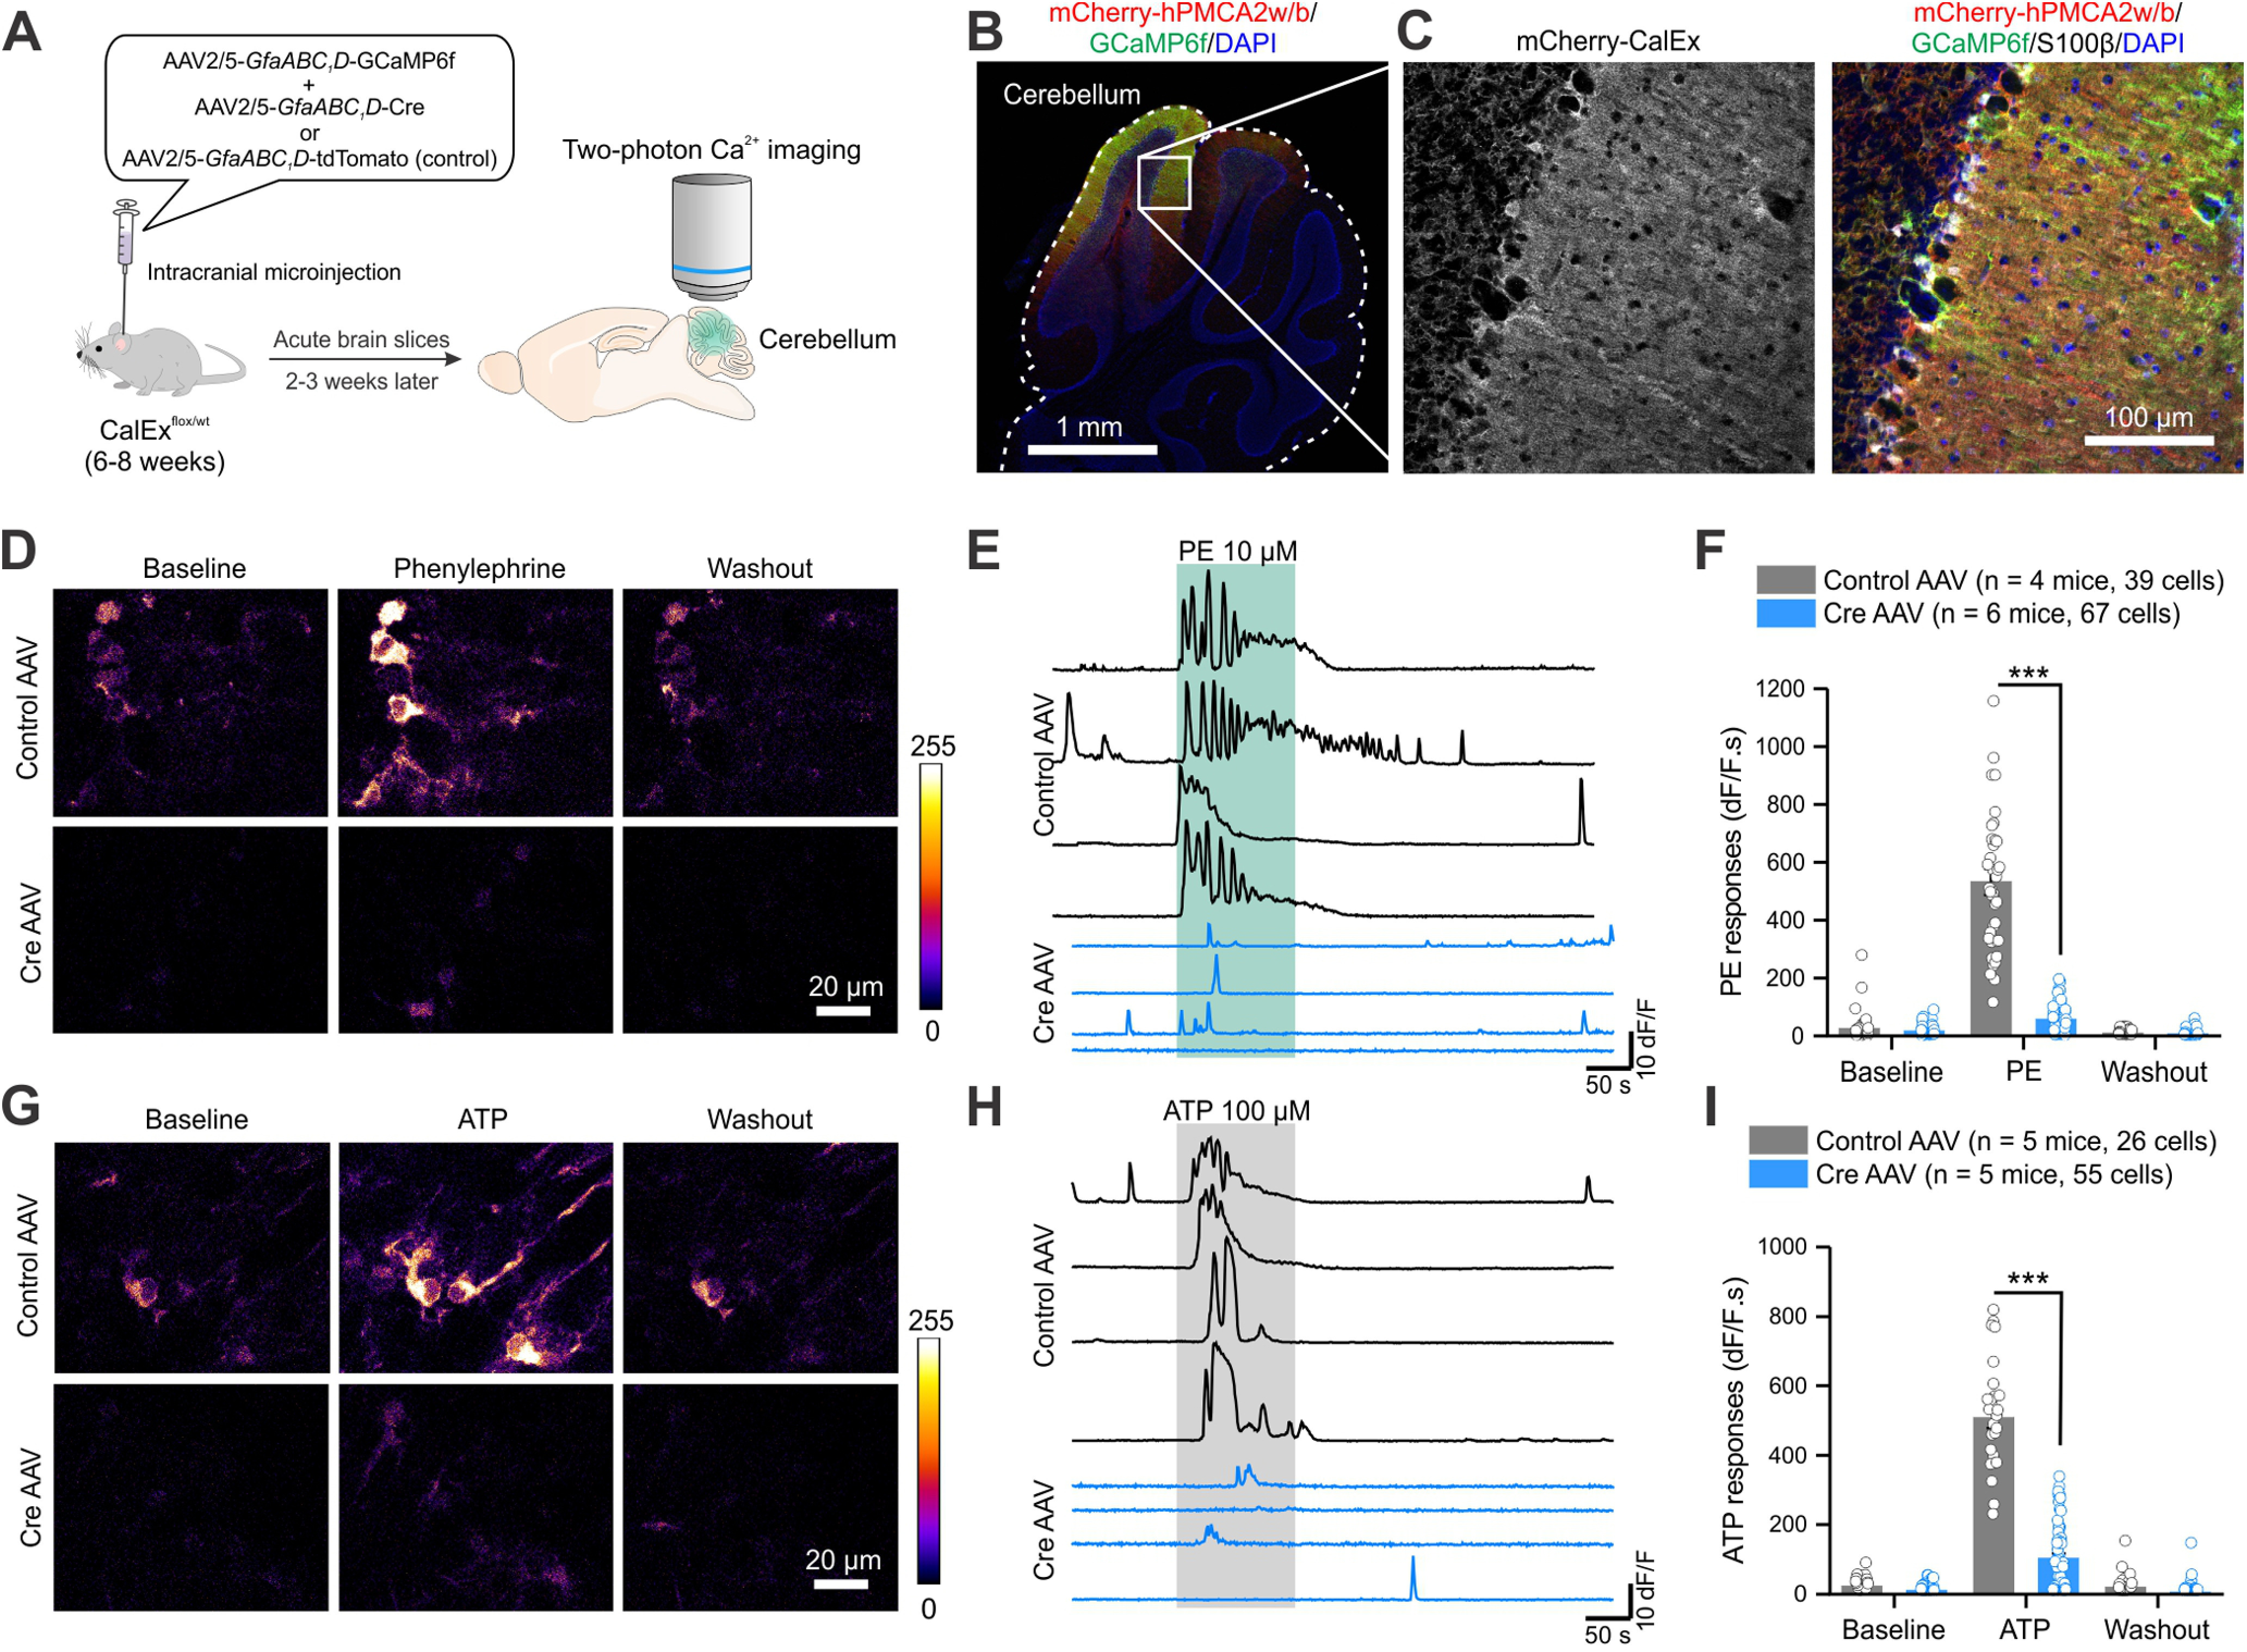
Attenuation of GPCR-mediated Ca2+ signaling in Bergmann glia with CalExflox mice. A, Schematic of experimental design. To image Ca2+ signals in Bergmann glia, CalExflox mice received microinjections of AAV2/5-GfaABC1D-GCaMP6f together with control or Cre AAVs. Two-photon Ca2+ imaging of GCaMP6f-expressing Bergmann glia was performed two to three weeks after the AAV injection. B, An IHC image of the entire cerebellum showing the expression of GCaMP6f and mCherry-hPMCA2w/b. C, Higher-magnification IHC images showing mCherry-hPMCA2w expression in Bergmann glia that was colocalized with GCaMP6f and S100β. D, Z-stack images of two-photon Ca2+ imaging of Bergmann glia from CalExflox mice microinjected with control (top) or Cre (bottom) AAVs during baseline, PE (10 μm) application, and washout. E, Representative traces of Ca2+ responses to PE in the somata of Bergmann glia from CalExflox mice with control (top) or Cre (bottom) AAVs. F, Quantification of PE-induced Ca2+ responses as integrated areas during baseline, PE application, and washout. G, Z-stack images of Bergmann glia from CalExflox mice microinjected with control (top) or Cre (bottom) AAVs during baseline, ATP (100 μm) application, and washout. H, Representative traces of Ca2+ responses to ATP in the somata of Bergmann glia from CalExflox mice with control (top) or Cre (bottom) AAVs. I, Quantification of ATP-induced Ca2+ responses as integrated areas during baseline, ATP application, and washout. Average data are shown as mean ± SEM; ***p < 0.001.