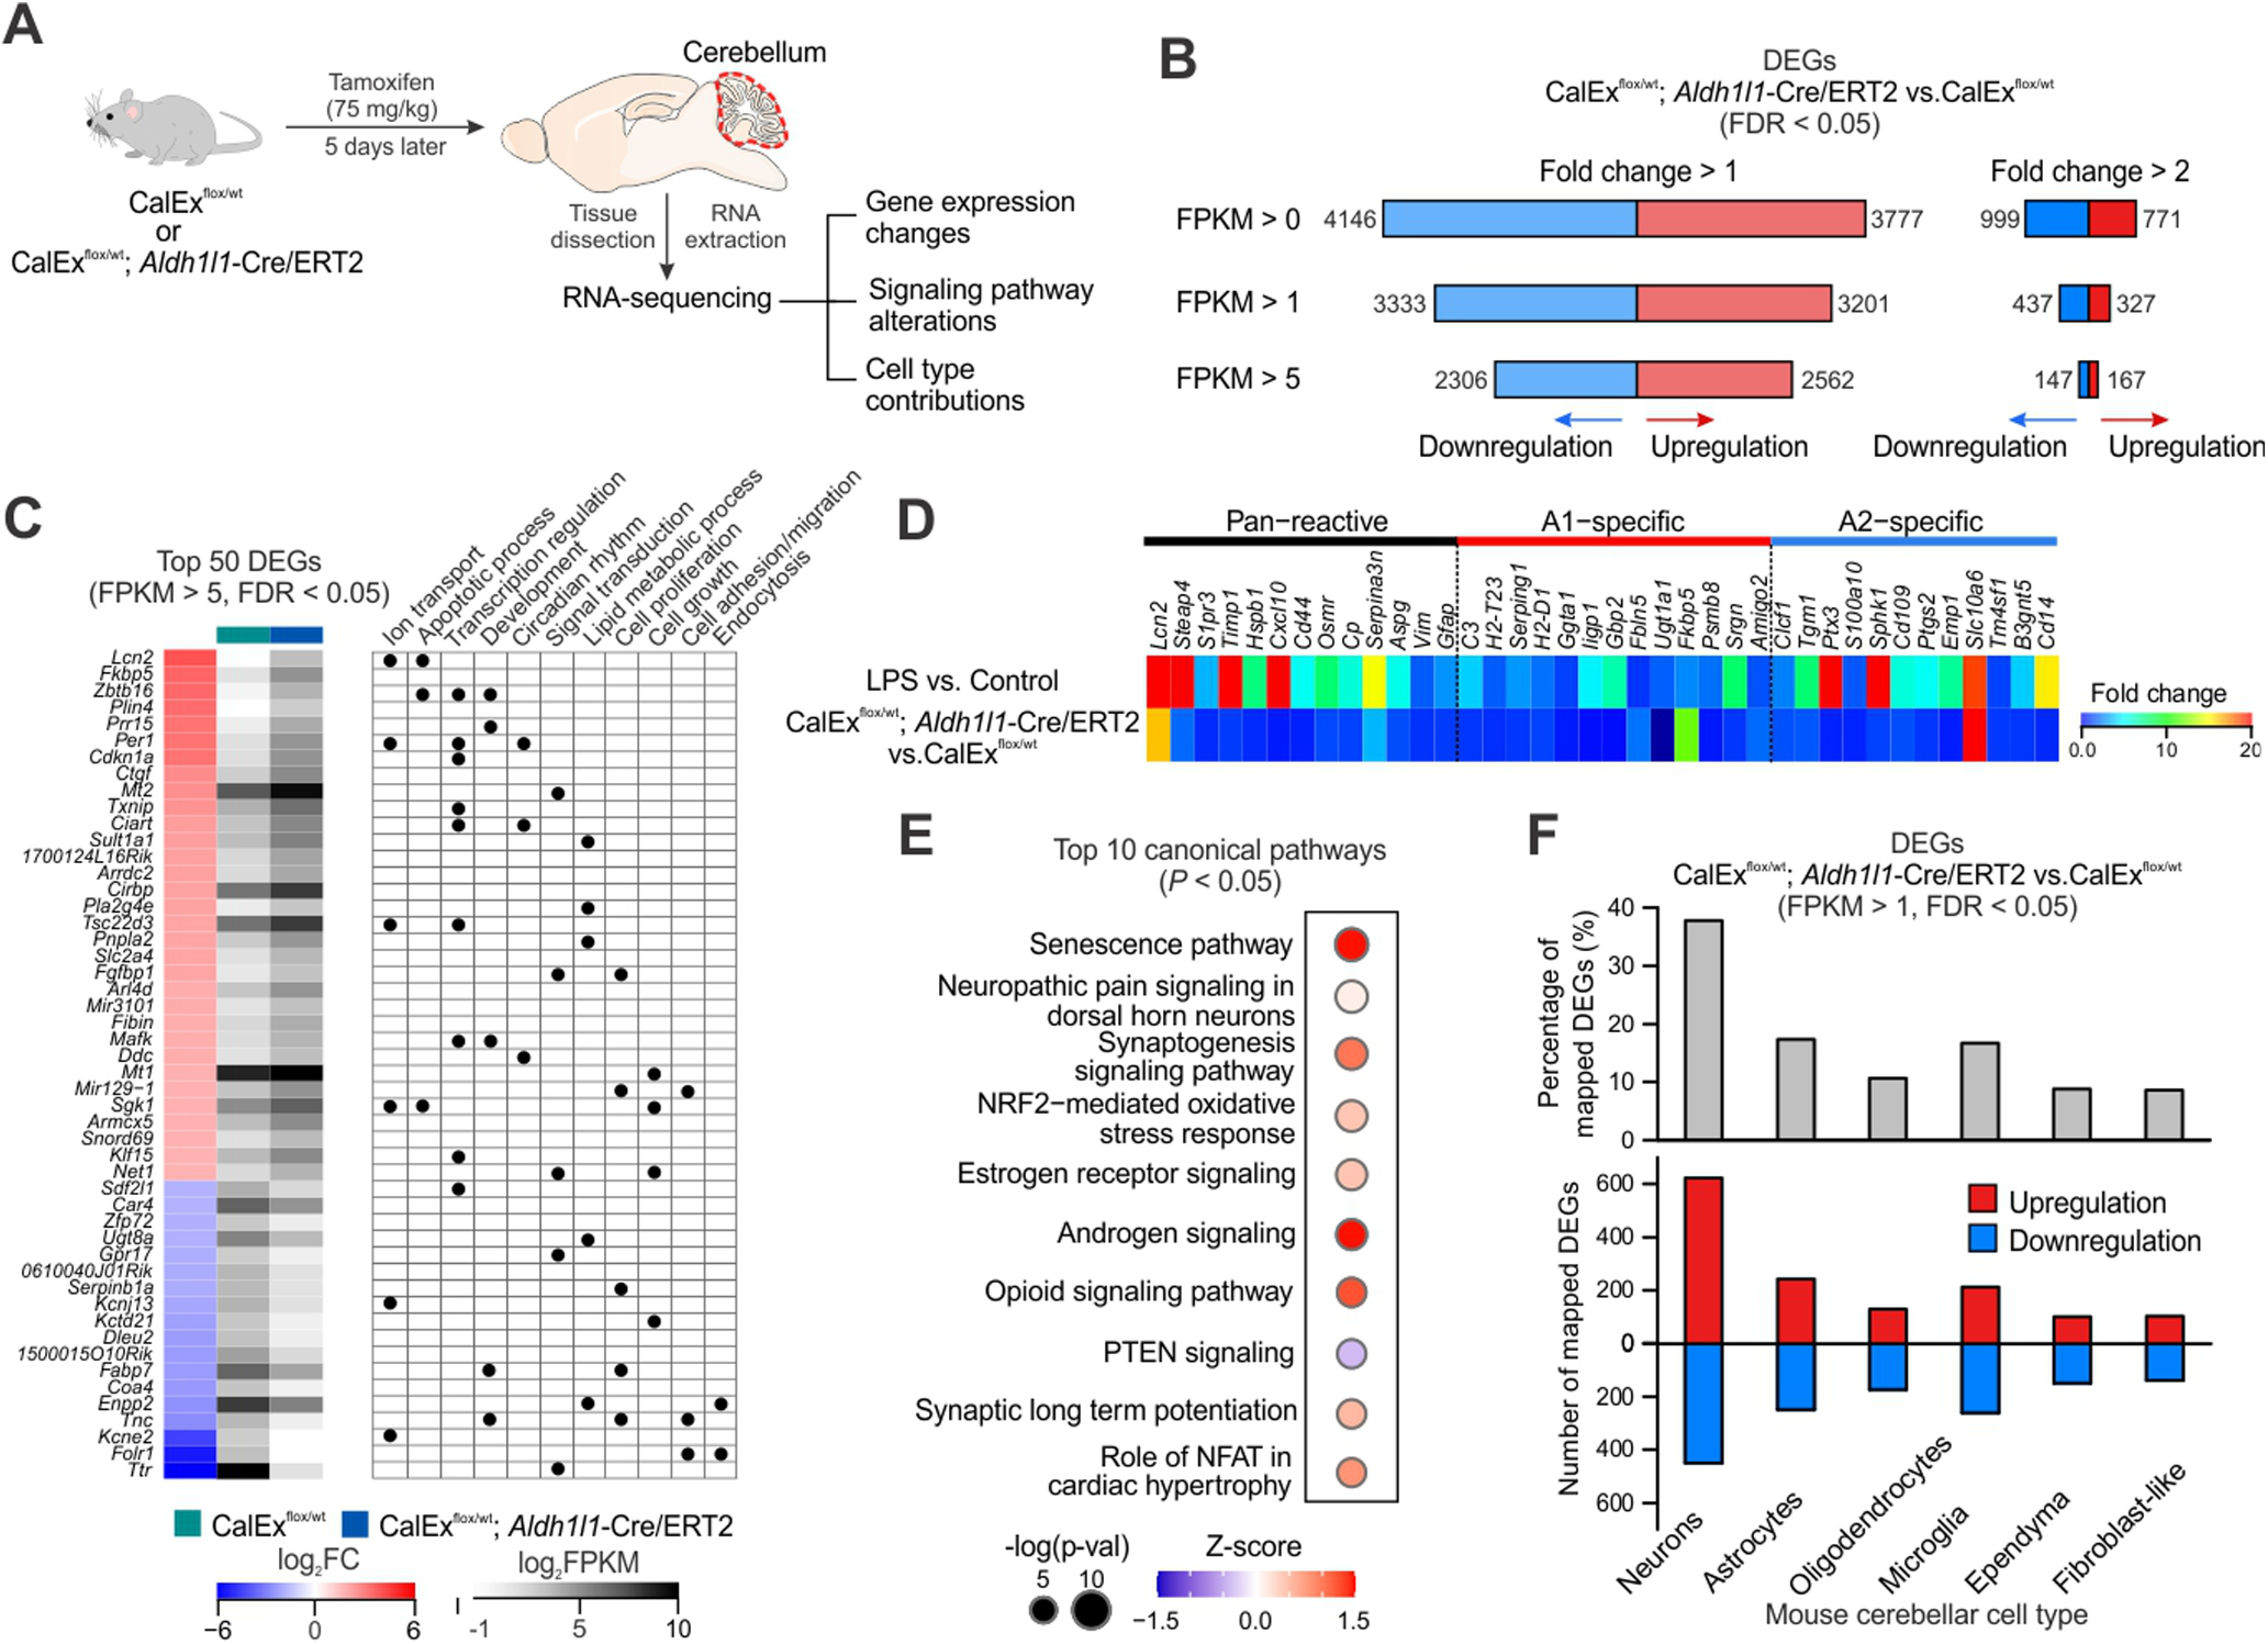
Figure 7.

Cerebellar RNA-seq reveals transcriptomic alterations induced by mCherry-hPMCA2w/b expression in bigenic mice. A, Schematic of experimental design. Both CalExflox mice (control) and bigenic mice received a single dose tamoxifen injection (75 mg/kg × 1 d) and cerebellar tissues were dissected out and processed for RNA-seq 5 d later. B, Numbers of DEGs (analyzed by edgeR, FDR < 0.05) that were upregulated and downregulated under different thresholds (FPKM > 0, 1 and 5; fold change > 1 and 2). C, left, Top 50 DEGs (FPKM > 5, FDR < 0.05) by mCherry-hPMCA2w/b expression in the cerebella of bigenic mice, ranked by fold change when comparing with CalExflox mice. Right, Summary table of selected gene ontology terms (biological processes) that are associated with each DEG. D, Heat map showing relative expression levels of 38 known reactive astrocyte markers including proposed pan-reactive, A1-specific and A2-specific genes in bigenic mice compared with control mice. E, Top 10 altered canonical pathways in cerebellar RNA-seq from bigenic mice. Sizes of dots represent log-transformed p value and colors indicate either pathway activation (red) or inhibition (blue) based on z scores. F, top, Percentage of DEGs in bigenic mice (FPKM > 1, FDR < 0.05) that were mapped onto mouse cerebellar scRNA-seq data, based on the top 1000 cell type marker genes for the six major cell types. Bottom, Numbers of mapped DEGs onto different cerebellar cell types that were upregulated and downregulated. List of DEGs identified in the cerebellar RNA-seq of bigenic mice are listed in Extended Data Table 7-1.
