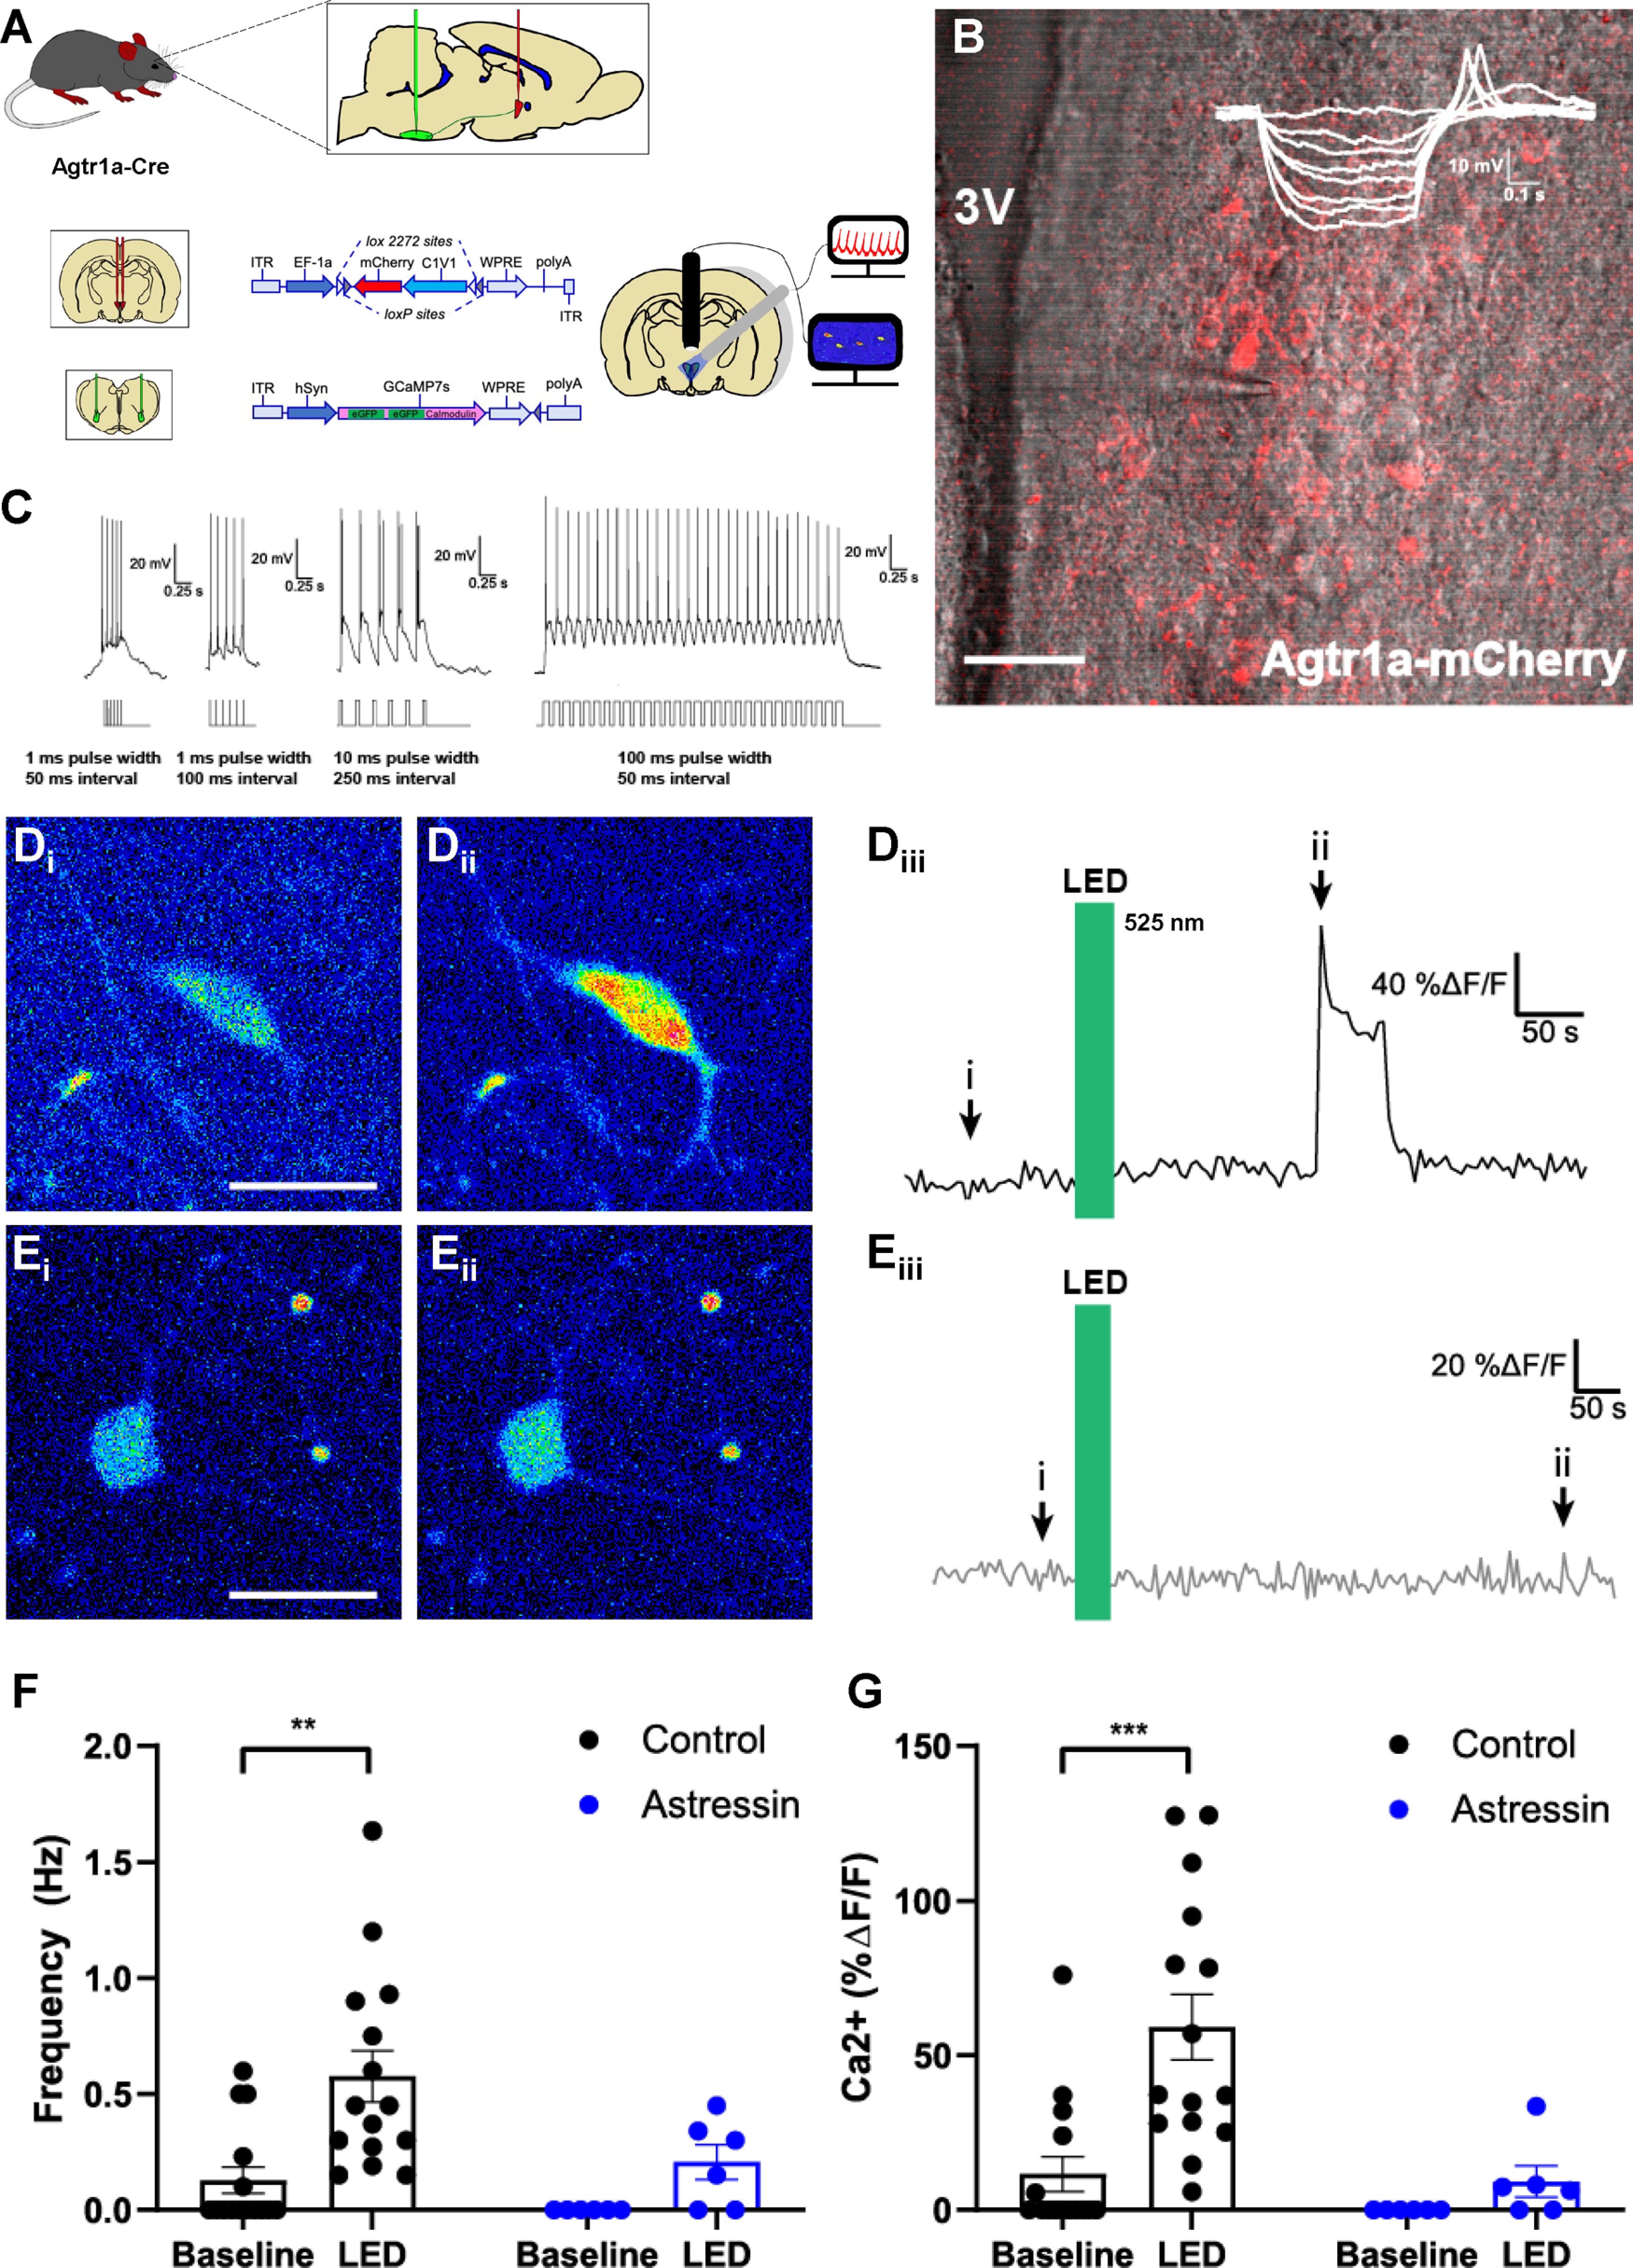
Figure 7.

Optogenetic excitation of PVNAgtr1a augments GCaMP7s fluorescence within PVN neurons that project to the RVLM. A, Schematic of the AAV injections used to direct the expression of rsChR2-mCherry to PVNAgtr1a while also driving retrograde expression of GCaMP7s in PVN neurons projecting to the RVLM. Fluorescence intensity is used as a proxy for neuronal firing and can be simultaneously recorded from multiple neurons in a slice through the PVN. B, Two-photon microscopy depicting PVNAgtr1a expressing mCherry (red) and rsChR2 within coronal slice through the PVN captured using Dodt gradient contrast imaging. Inset, I–V curve with a low threshold depolarization, indicating the patched neurons exhibit electrophysiological characteristics of a parvocellular cell. 3V, Third ventricle. Scale bar, 50 µm. C, Further characterization of a patched PVNAgtr1a neuron with different optogenetic stimulation protocols. Stimulus waveforms appear below the neuron's response. When pulse interval becomes too short, the spikes occur on the same depolarization, but spike count corresponds with LED pulses. A protocol consisting of 30 pulses with a 100 ms width and a 50 ms interval is the standard protocol used in these experiments unless otherwise noted. D, GCaMP7s fluorescence within RVLM-projecting neurons (Di) under basal conditions and (Dii) after LED stimulation of PVNAgtr1a. Scale bar, 25 µm. Diii, ROI trace from neuron shown in Di,ii representing the time course of the increased GCamP7s fluorescence that was observed before, during, and after LED stimulation of PVNAgtr1a. E, GCaMP7s fluorescence within RVLM-projecting neuron (Ei) under basal conditions and (Eii) after LED stimulation of PVNAgtr1a in the presence of Astressin (0.5 μm). Scale bar, 25 µm. Eiii, ROI trace from neuron shown in Ei,ii representing the time course of GCamP7s fluorescence that was observed before, during, and after LED stimulation of PVNAgtr1a when Astressin (0.5 μm) is present. F, Left, Ca2+ frequency (Hz), as indicated by GCaMP7s fluorescence within RVLM-projecting neurons, increases after LED stimulation of PVNAgtr1a (p = 0.001, two-way ANOVA followed by Tukey's post hoc test, n = 15 cells from 5 animals). Right, Ca2+ frequency (Hz) does not significantly increase after LED stimulation of PVNAgtr1a in the presence of Astressin (p = 0.64, two-way ANOVA followed by Tukey's post hoc test, n = 6 cells from 3 animals). G, Left, Ca2+ amplitude (%ΔF/F), as indicated by GCaMP7s fluorescence within RVLM-projecting neurons, increases after LED stimulation (p = 0.0003, two-way ANOVA followed by Tukey's post hoc test, n = 15 cells from 5 animals). Right, Ca2+ amplitude (%ΔF/F) does not significantly increase in the presence of Astressin (p = 0.9, two-way ANOVA followed by Tukey's post hoc test, n = 6 cells from 3 animals).
