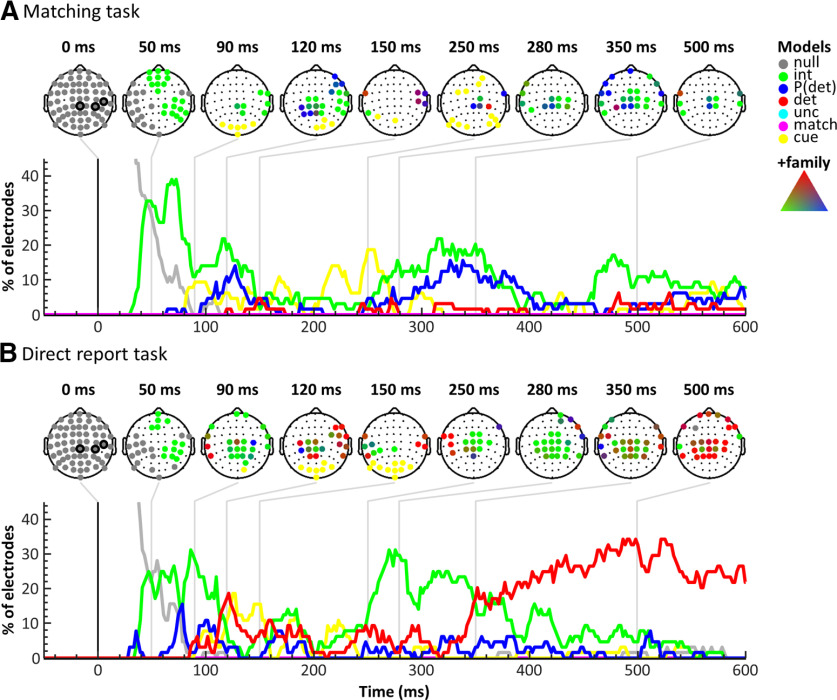
Figure 5.
BMS results across electrodes in the matching task (A) and the direct report task (B). For each task, scalp topographies for time points of interest (top) and model time courses across electrodes (bottom) are displayed. The scalp topographies indicate winning models in electrodes surpassing the threshold criteria using colors as in Figure 3. The circled electrodes at 0 ms represent electrodes CP4, C6, and CPz. Model time courses are plotted as the proportion of electrodes showing above-threshold effects over time. The results suggest a striking reduction of target detection effects (red) in the matching task compared with the direct report task, especially in late time windows >350 ms.

