Figure 3.

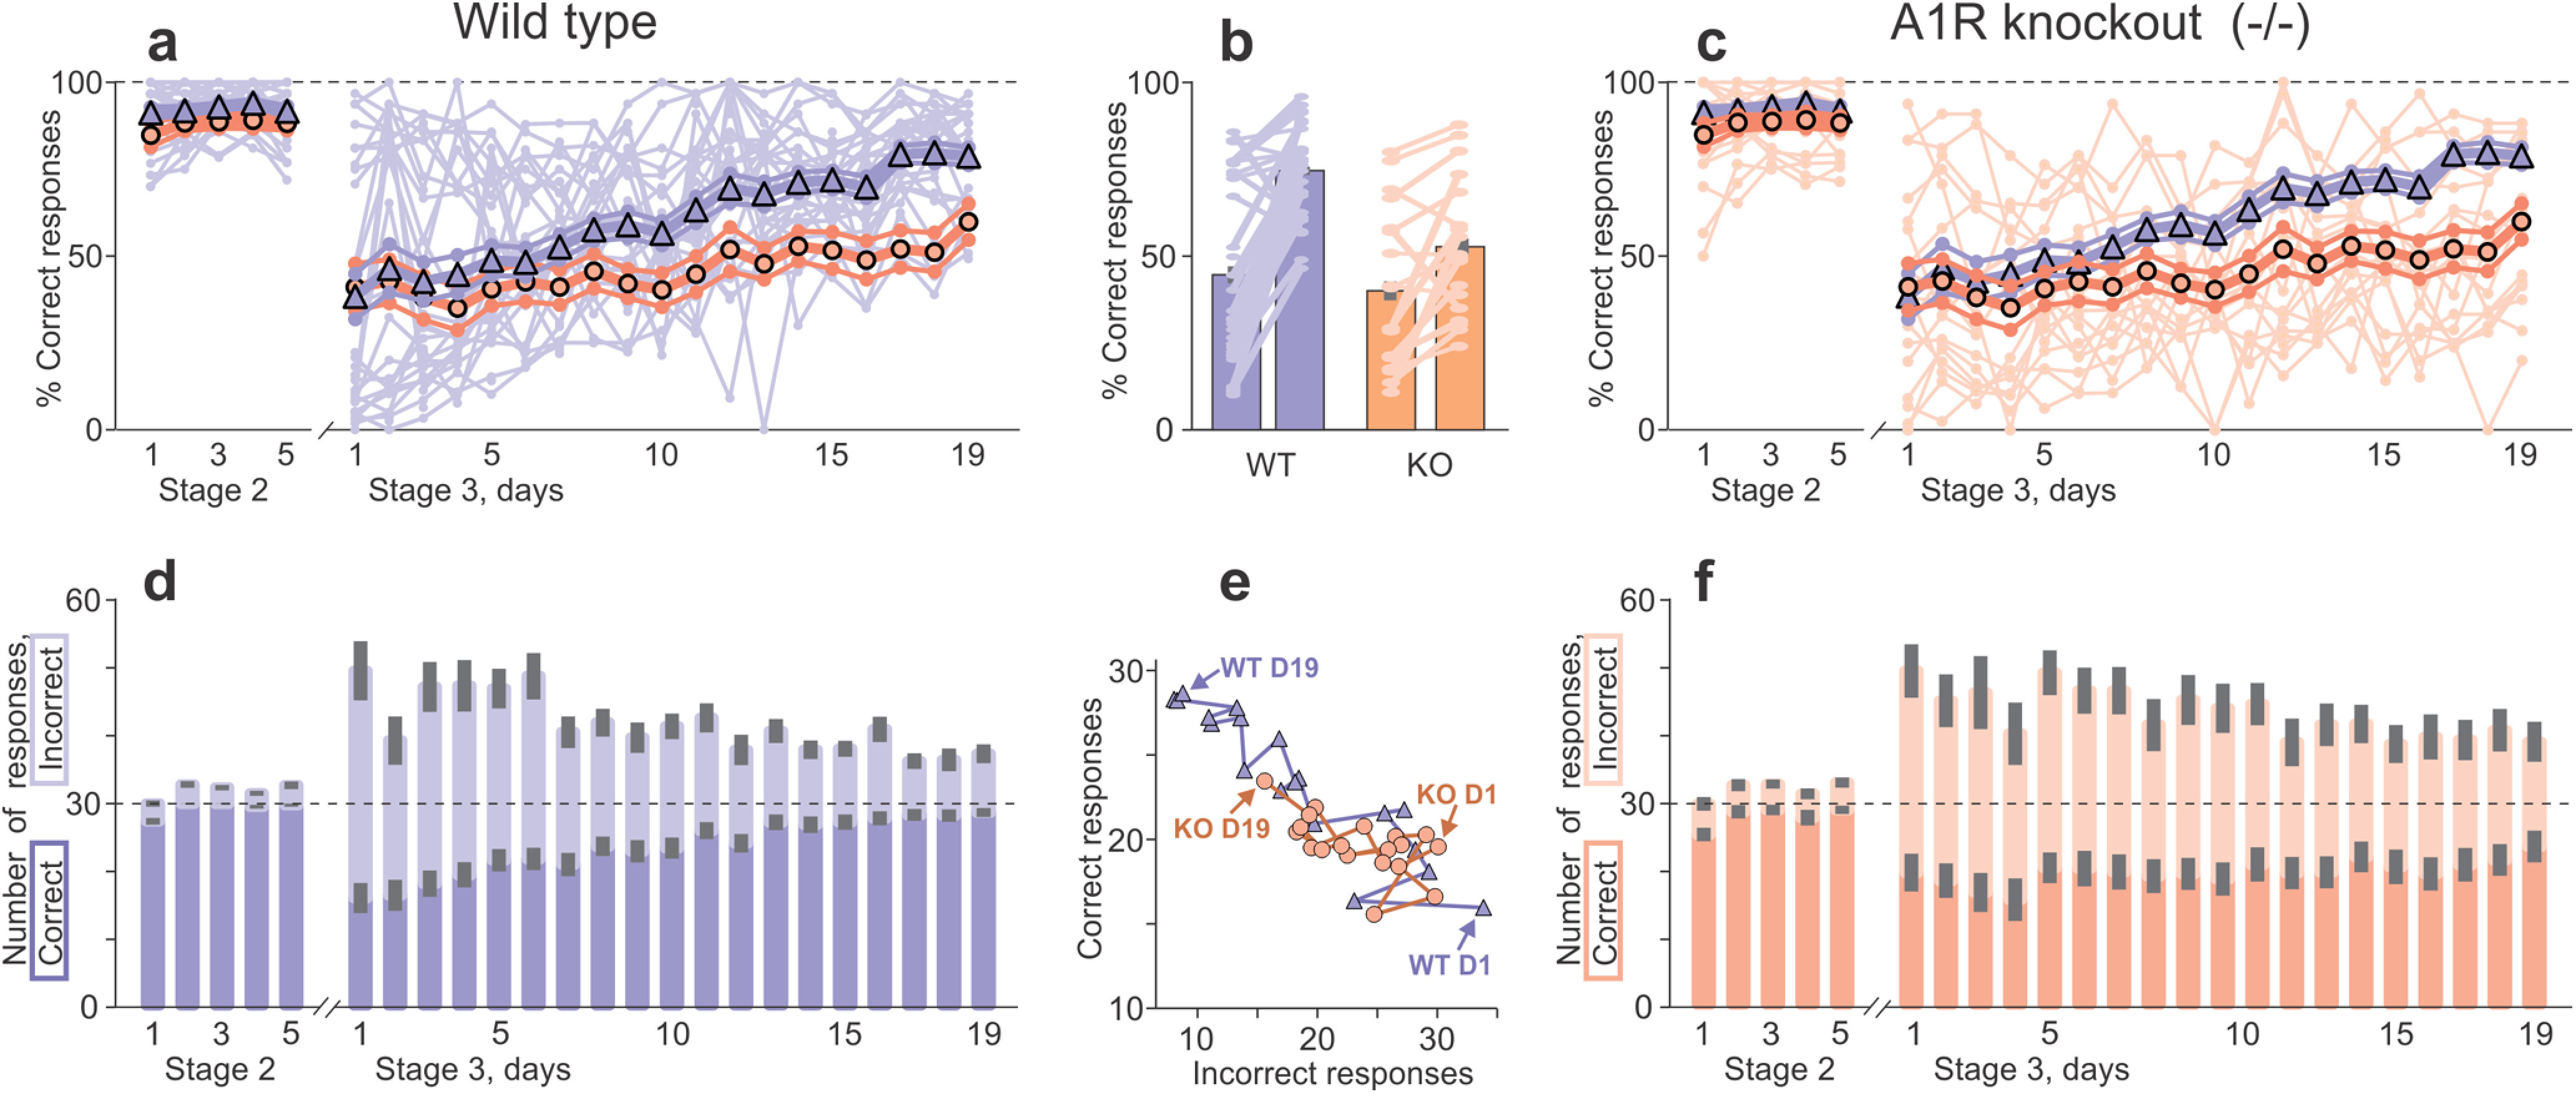
Learning on a difficult but not on a simple visual task is impaired in A1R KO mice. a, c, Percentage of correct responses on consecutive testing days 1–5 of learning to touch one stimulus presented on the screen for food reward (stage 2) and days 1–19 of pairwise discrimination, learning to touch correct stimulus of the two presented (stage 3). Pale lines and dot symbols show data for each WT (a) and KO (c) mouse. Large symbols and thick lines show daily averages with SEM for N = 30 WT (triangles, blue) and N = 18 A1R KO (circles, orange) animals. In a and c, averaged data for both WT and KO groups are shown to facilitate comparison. b, Percentage of correct responses during days 1–6 and days 14–19 of pairwise discrimination learning; averages for WT (blue) and KO (orange) groups, and data for each mouse (connected pale symbols). Learning in KO mice: from 40.3 ± 5.5 to 52.7 ± 4.7%; paired Wilcoxon test: V = 145 p = 0.008; paired t test: t = 3.054, df = 17, p = 0.007; learning in WT mice: from 44.9 ± 4.9 to 75.1 ± 2.4%, p < 0.001; paired Wilcoxon test, V = 437; paired t test: t = 6.23, df = 29. Before learning: no difference between WT and KO (p > 0.1, KS and t tests); after learning: p < 0.001; KS test, D = 0.589; t test, t = −4.26, df = 25.69. d, f, Number of correct (darker color) and incorrect (lighter color) responses with SEM (gray bars) on consecutive testing days of stags 2 and 3 learning in WT (d) and KO (f) groups. Horizontal dashed line shows maximal possible number (30) of correct responses per 1 d. e, Number of correct responses plotted against number of incorrect responses on each day of pairwise discrimination task (stage 3, days 1–19) for WT (blue triangles and line) and KO (orange circles and line) groups. Arrows indicate data from the first (D1) and the last (D19) day of testing for WT and KO groups; lines connect data points from consecutive days. See Extended Data Figure 3-1 for details of statistical analyses.
