Figure 1.

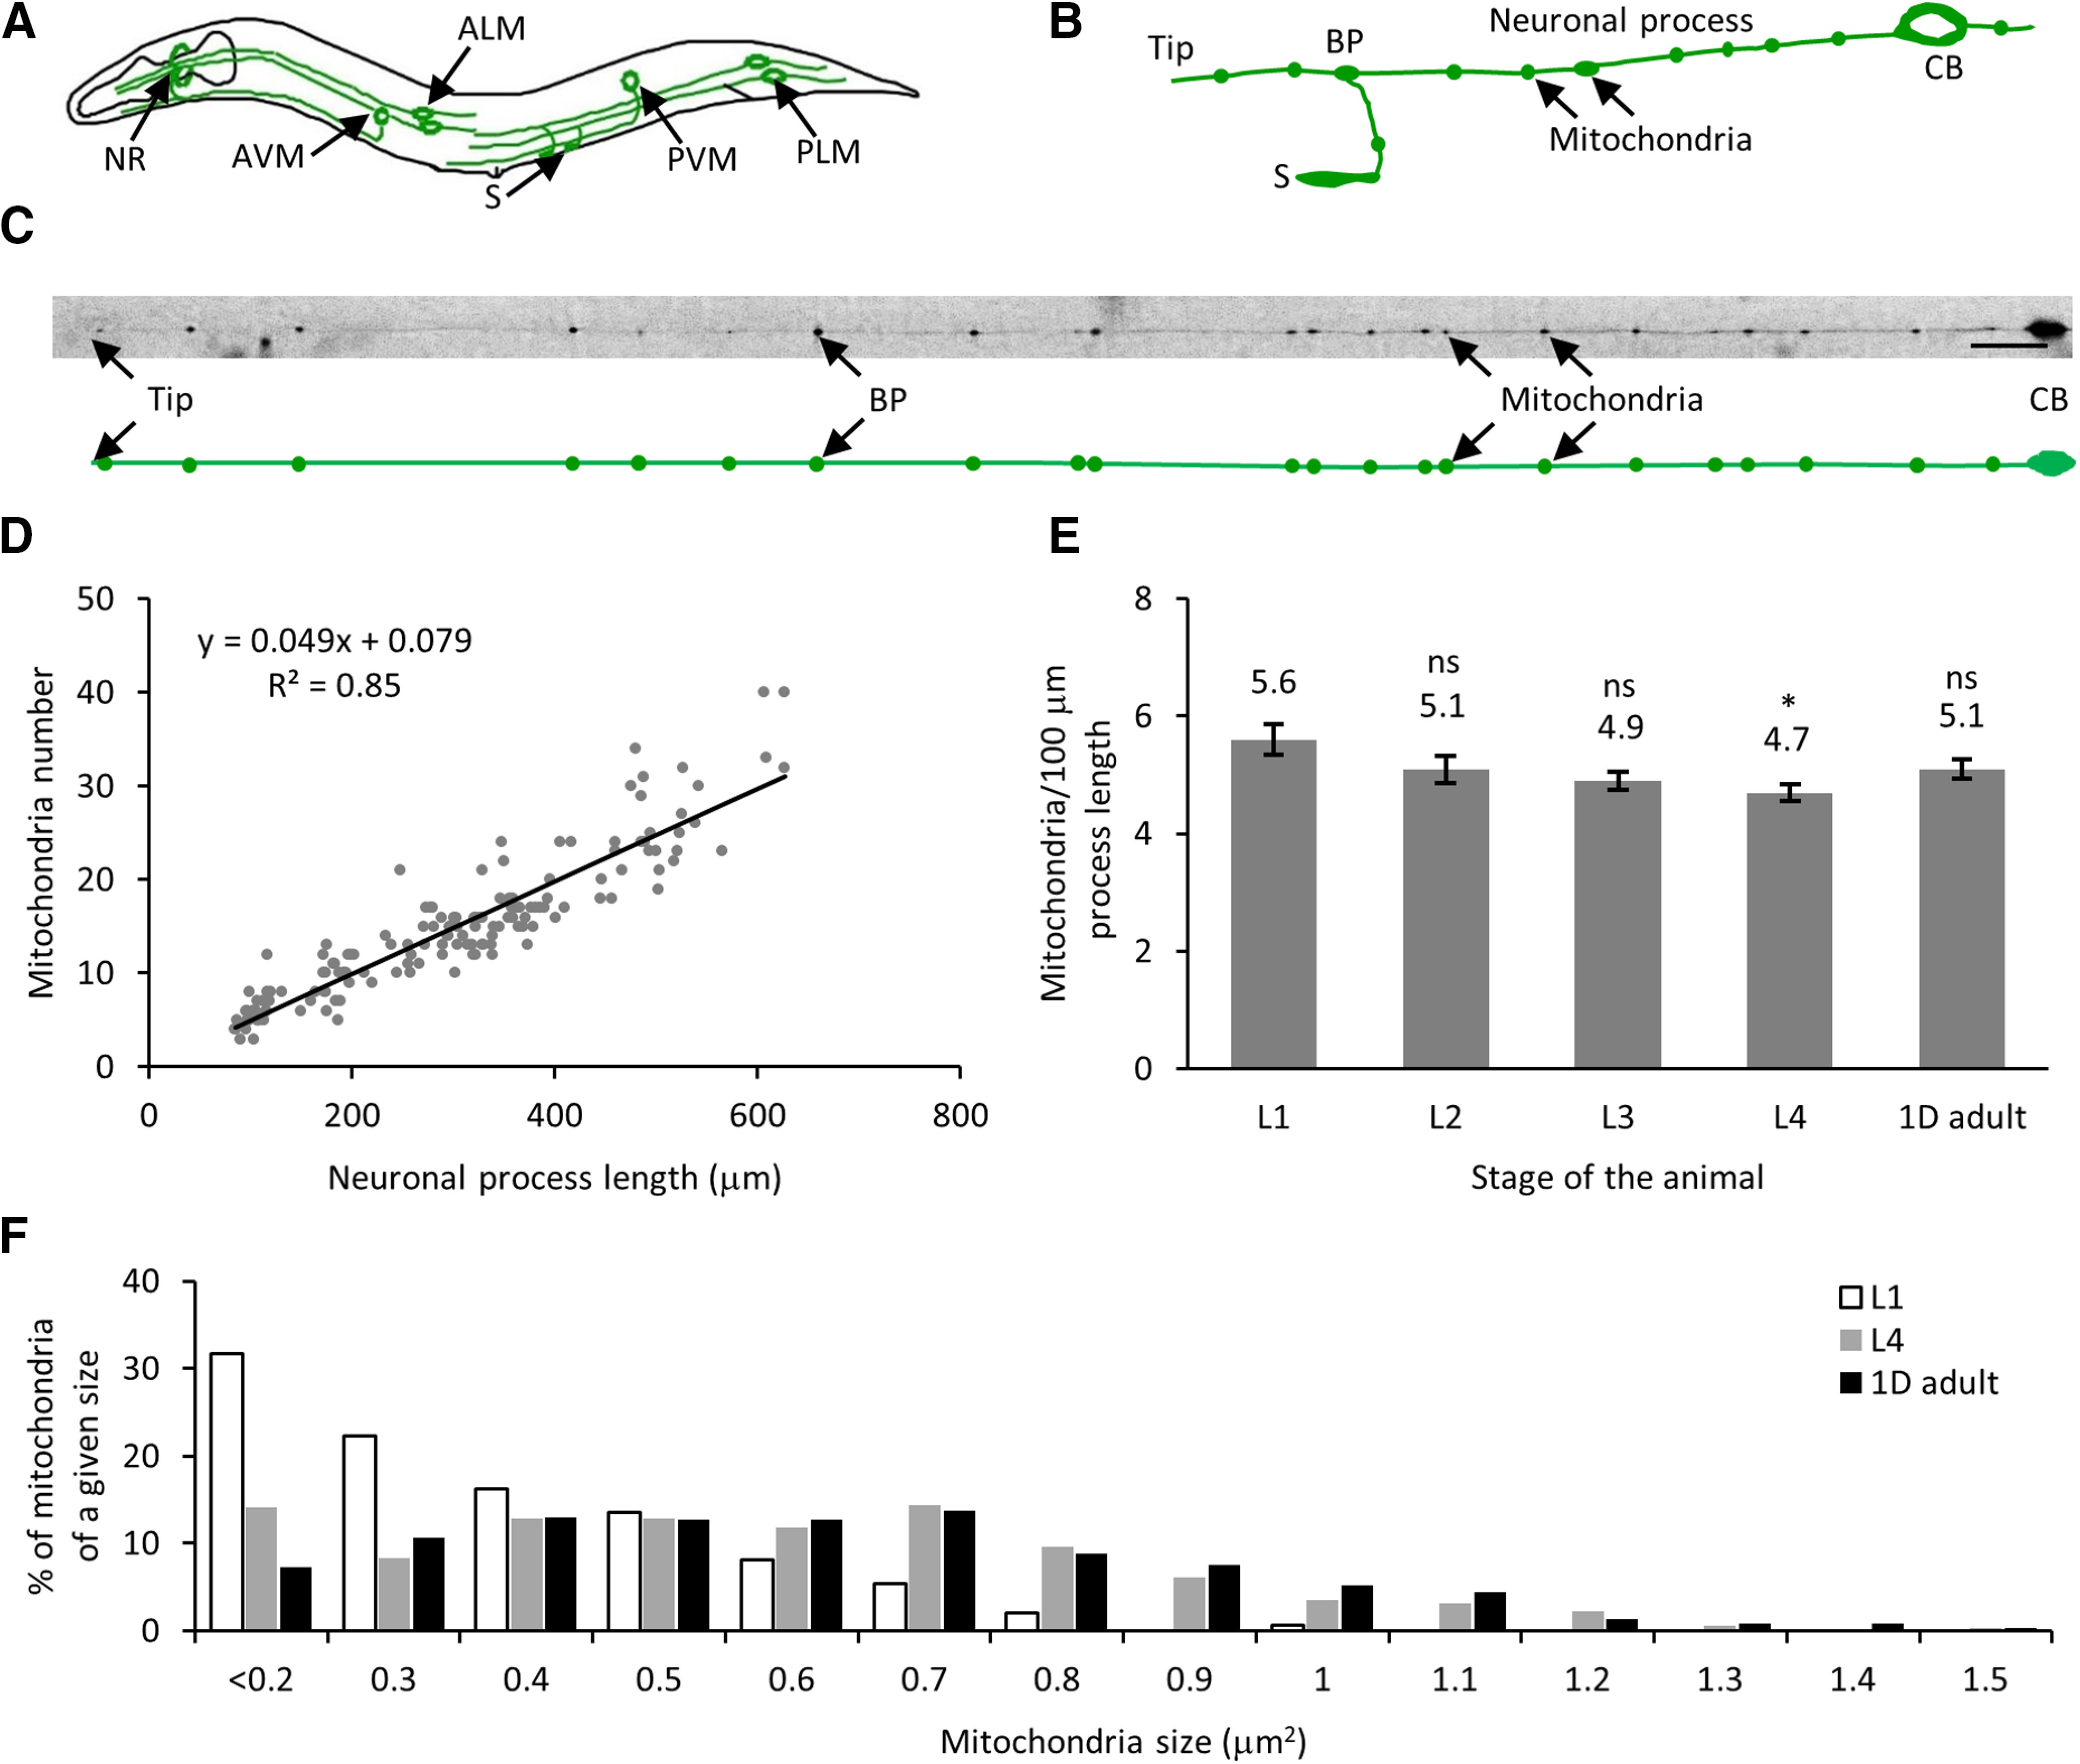
Mitochondria number and process length increase linearly with development. A, Schematic of C. elegans with six TRNs. B, Schematic of PLM neuron cell body (CB) with a long major neuronal process with a bifurcation of the process at the BP to form the synaptic branch that forms synapses (S) along the ventral cord. The mitochondria are indicated with arrows. C, Image of a PLM neuron with 22 mitochondria along the neuronal process. The schematic below the image shows the positions of all 22 mitochondria in the same neuronal process. Scale bar: 20 μm. D, Mitochondria number scales linearly with neuronal process length. Neuronal process length and number of mitochondria of all four larval stages (L1, L2, L3, and L4) and 1D adult. The trend follows a linear regression with a slope of 4.9 mitochondria in 100-μm neuronal process length (total number of animals = 154). E, Mitochondria density remains constant throughout development. Data represented as mean ± SEM for L1 (n = 30), L2 (n = 25), L3 (n = 36), L4 (n = 33), and 1D adult (n = 30). Statistical significance was evaluated using one-way ANOVA with Bonferroni post hoc comparisons; *p < 0.05 and ns, p > 0.05 when compared with L1 stage. F, Histogram of the normalized number of mitochondria of a given size represented as a % in the TRNs of L1, L4, and 1D adult stage of animals (n ≥ 148 mitochondria for each stage).
