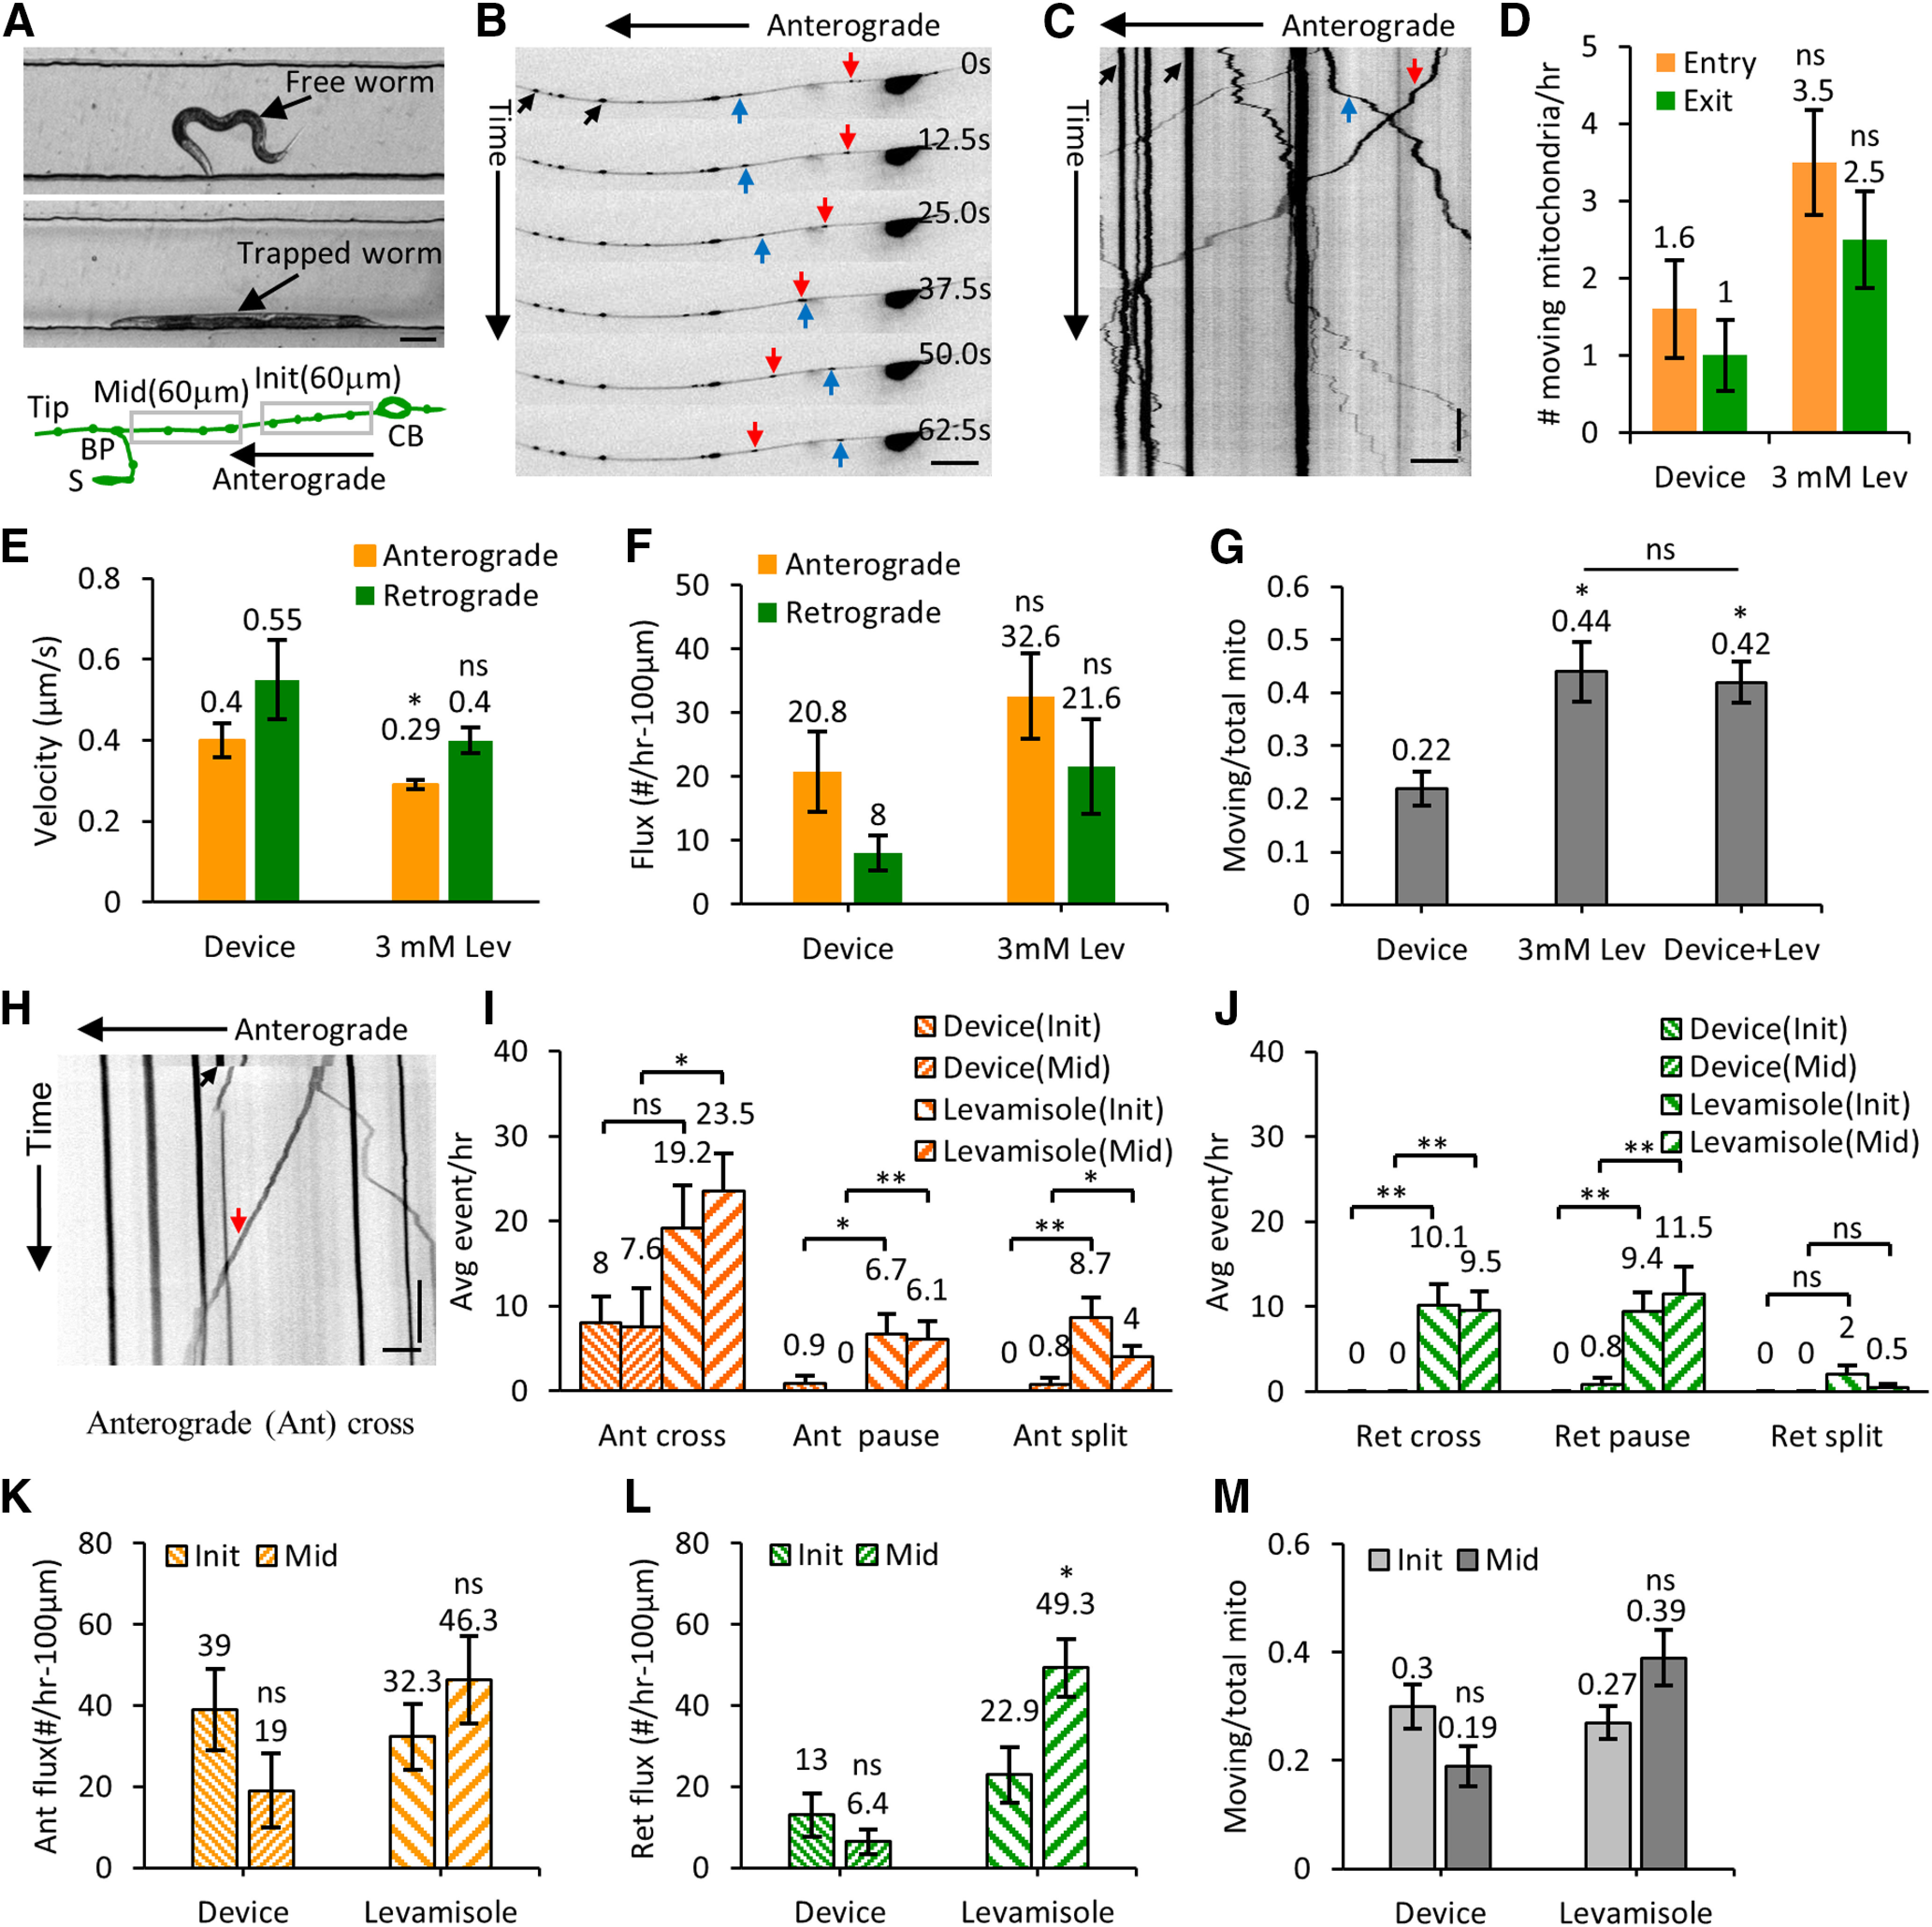
Figure 3.

High-resolution transport imaging of GFP-labeled mitochondria in levamisole and device immobilized C. elegans neurons. A, Image of a free and an immobilized L4 stage C. elegans in the flow channel. The schematic shows the initial 60 μm from the cell body and the middle of the neuronal process (120 μm from the BP toward the cell body) that is imaged at high resolution. B, Montage of six frames of a PLM neuron with GFP-labeled mitochondrial fluorescence from time-lapse imaging acquired using a 60× oil objective (1.4 NA). C, Kymograph of 400 frames acquired at 2 fps for 200 s. Anterogradely moving (red arrow), retrogradely moving (blue arrow), and stationary (black arrow) mitochondria are indicated on the images. D, Number of mitochondria entering the neuronal process (entry) and leaving the process (exit) per hour measured in animals immobilized with 3 mM levamisole (n = 35 animals) and inside the microfluidic device (n = 22 animals). E, The average velocities (both in anterograde and retrograde directions) are shown for animals that are immobilized inside the microfluidic device (n = 47 anterograde and n = 15 retrograde segments) and compared with animals immobilized with 3 mM levamisole (n = 336 anterograde and n = 142 retrograde segments). F, The average flux values of moving mitochondria from L4 stage animals immobilized inside the microfluidic device (n = 16) and with 3 mM levamisole (n = 18). G, The plot showing the ratio of moving mitochondria to the total number of mitochondria for device immobilized (n = 16), levamisole immobilized (n = 18), and levamisole treated animals that are also immobilized in the device (n = 14). H, Kymograph representing an anterograde moving mitochondrion (red arrow) crossing a site of a bleached stationary mitochondrion (black arrow). I, The average anterograde events per hour (cross, pause, and split) are measured at the initial (Init; 60 μm from the cell body) and the middle (Mid; a region 120 μm from the BP toward the cell body) of the neuronal process (schematic is shown in panel A) for both device (Device; n > 8 animals) and anesthetic (Levamisole; n > 29 animals) immobilized L4 animals. J, The average retrograde events are measured by using the device and anesthetic immobilized animals. K, The anterograde flux are measured from all the moving mitochondria in the device and levamisole immobilized L4 animals from the Init and Mid of the PLM neuronal process. L, The retrograde flux are measured from all the moving mitochondria in the device and levamisole immobilized L4 animals from Init and Mid neuronal processes. Anterograde and retrograde fluxes are calculated from n = 10 (Init) and n = 10 (Mid) animals in the device, while n = 16 (Init) and n = 26 (Mid) animals in the levamisole. M, The ratio of moving mitochondria to the total number of mitochondria for the Init and Mid portion of the PLM in the device and levamisole immobilized animals. Data represented as mean ± SEM (D, E–G, I–M). Statistical significances are evaluated by paired sample t test (D–F, I–M) and one-way ANOVA (G); *p < 0.05, **p < 0.005, and ns, p > 0.05 are represented. Scale bars: 100 μm (A), 10 μm (B, H), and 5 μm (C). Vertical bars: 20 s (C, H). Table 2, Extended Data Figures 3-1, 3-2, and Movies 1, 2, 3 support this figure.
