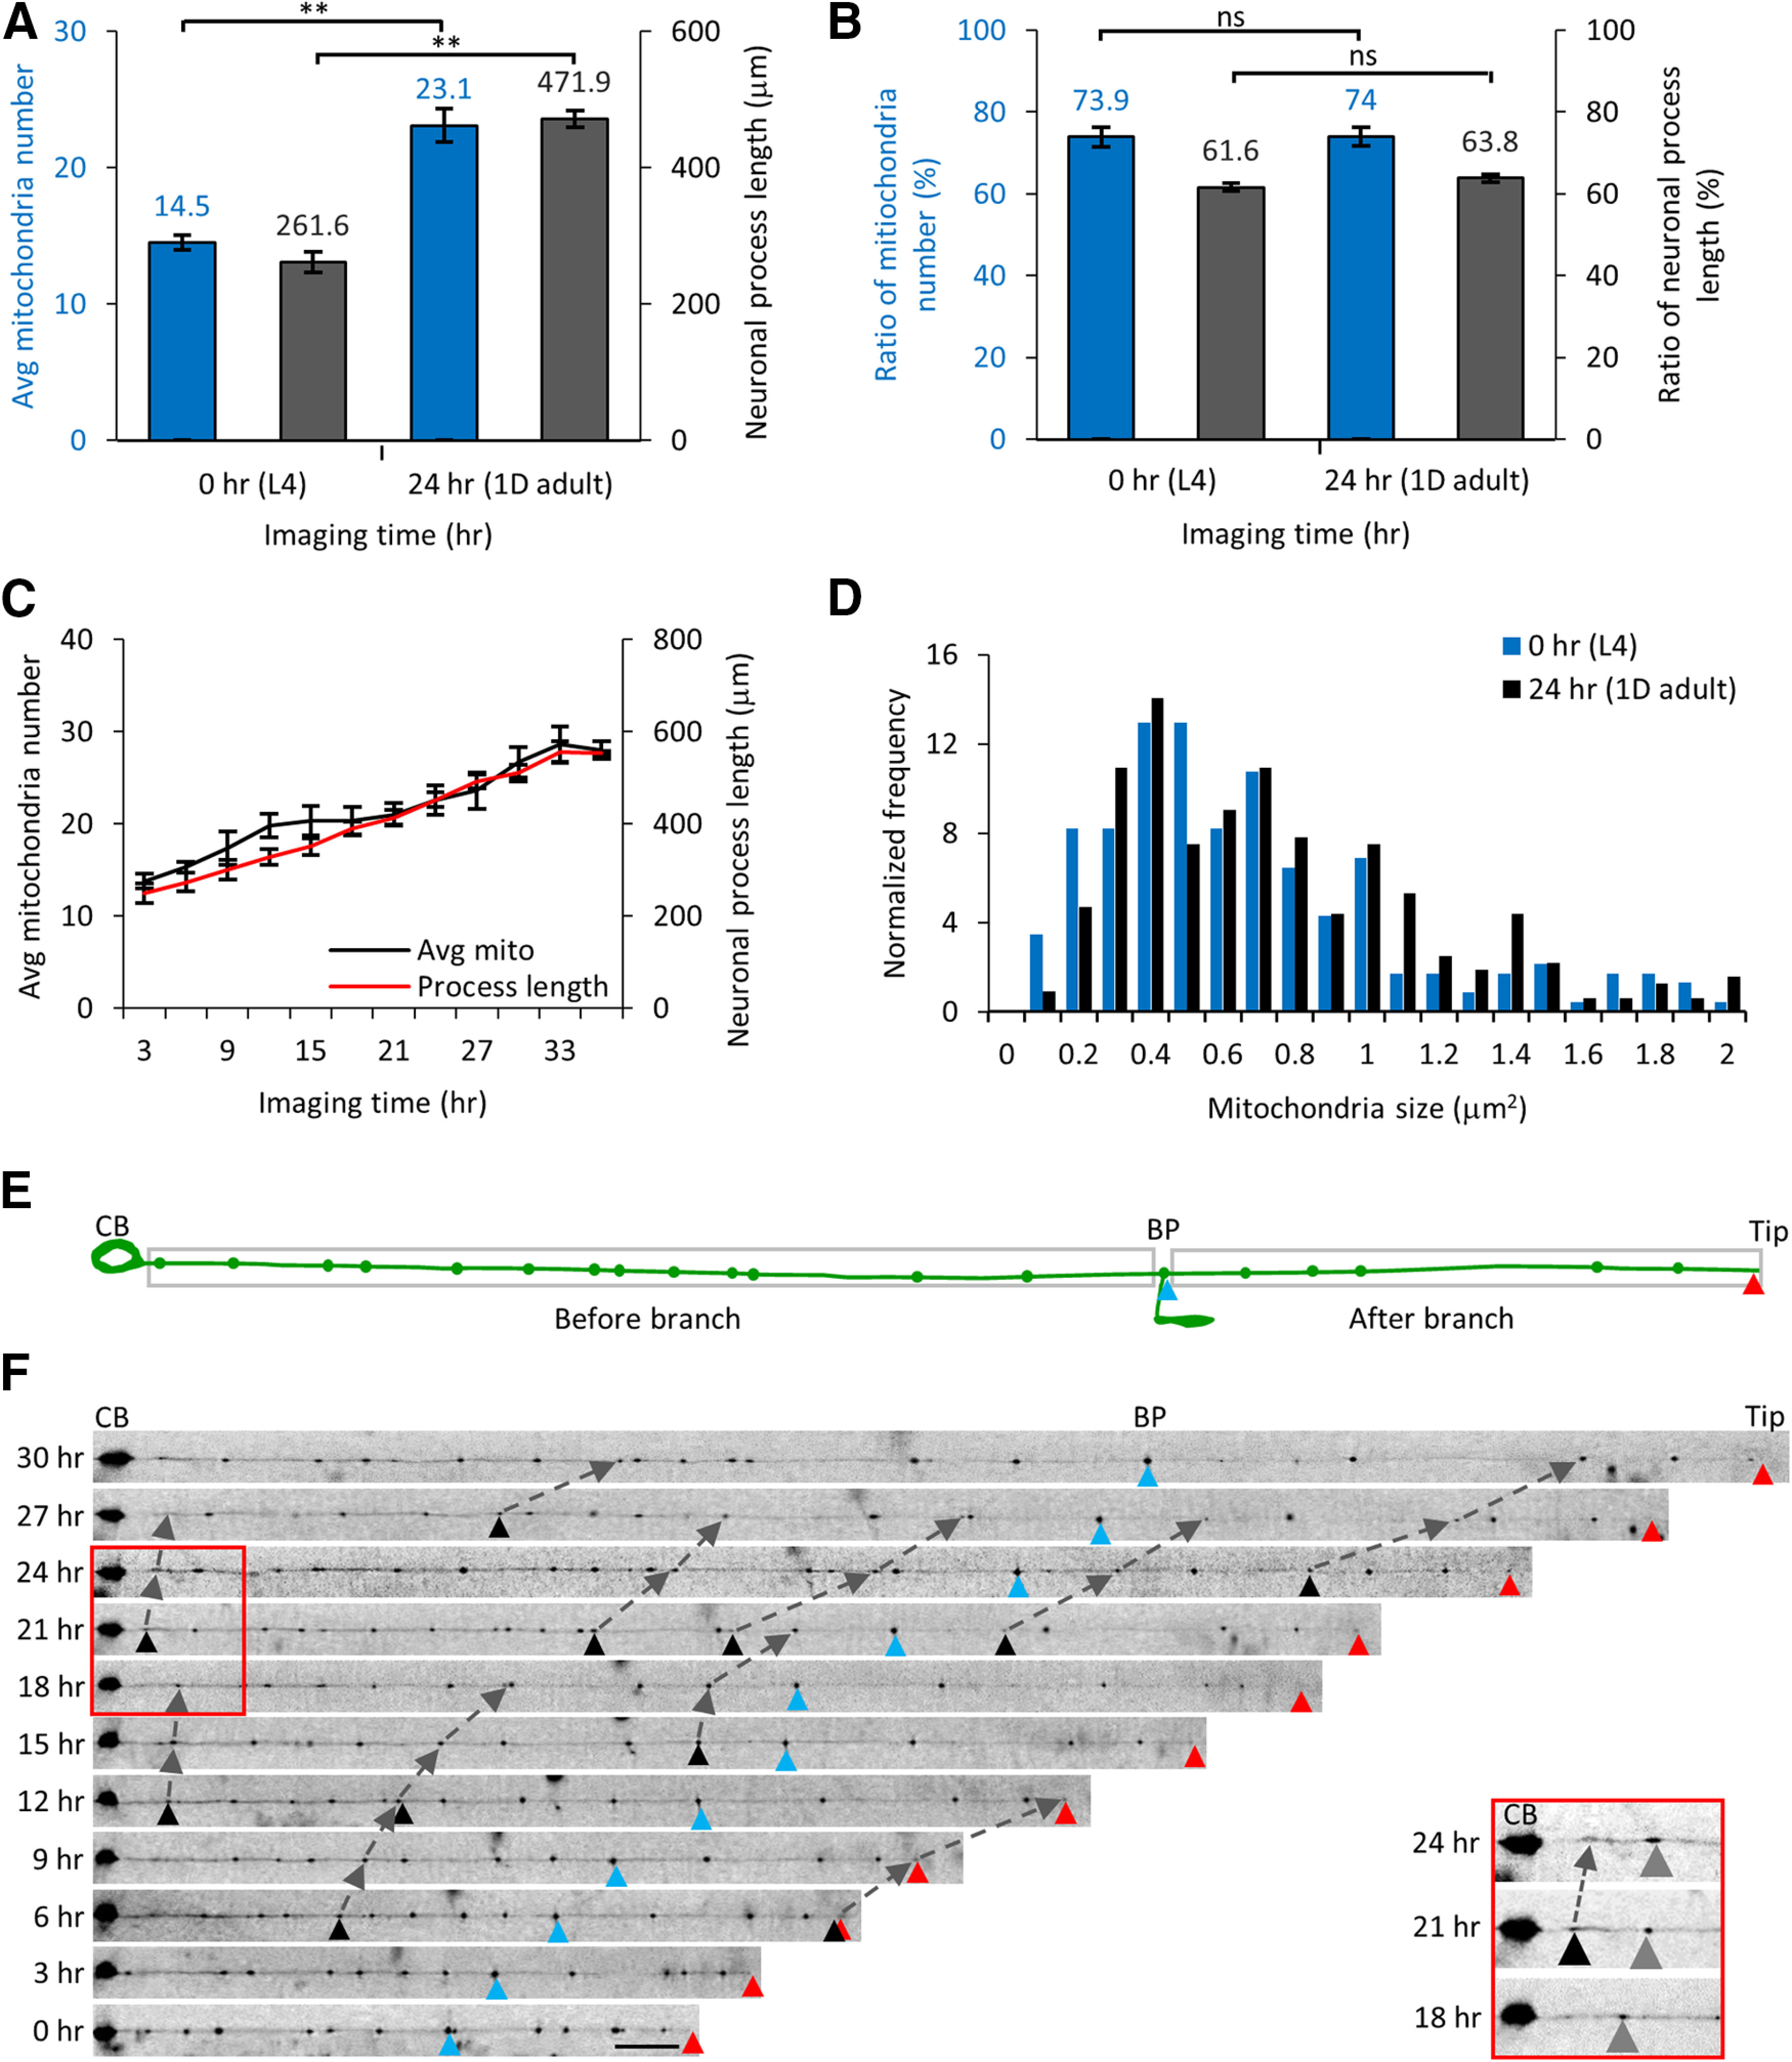
Figure 4.

Total number of mitochondria increases linearly in TRNs in animals growing inside microfluidic devices. A, The average number of mitochondria and the neuronal process length increases starting at 0 h (L4) to 24 h (1D adult) of imaging time inside the microfluidic device. B, The ratio of the mitochondria number and the process length was unchanged over this 24 h imaging time period. The ratio is calculated for the values from the cell body (CB) to the BP and from the BP to the neuronal tip. Statistical significance was evaluated by paired sample t test; *p < 0.05, **p < 0.005, and ns, p > 0.05 when comparing between the 0- and 24-h imaging time point data. C, Time course of the mitochondrial number and neuronal process length from eight animals imaged every 3 h in microfluidic devices beginning at L4 stage. Data represented as mean ± SEM (n = 8 animals). D, The relative frequency distribution of all mitochondria sizes at 0- and 24-h imaging time points (n = 8 animals). Statistical significance was evaluated by paired sample t test (p = 0.92). E, A schematic of the TRN shows the neuronal process with the CB, the neuronal process end (Tip, red triangle), and the BP (blue triangle) as fiduciary markers. The BP is used to estimate the total mitochondria number and neuronal process length between the CB and the BP and between the BP and the end of the neuronal process. F, The same animal was trapped inside the microfluidic device every 3 h and mitochondria imaged at high-resolution from the same TRN. Fluorescence images were straightened and raw images are displayed. The fiduciary markers of the CB, BP, and neuronal process end are used as references. New mitochondria added are labeled with black triangles and followed in two successive imaging time points and marked using dashed lines. Scale bar: 20 μm. The red box and the inset show a section of the neuronal process at 18-, 21-, and 24-h time points after start of imaging. A new mitochondrion (black triangle) is added in between the CB and a stationary mitochondrion (gray triangle). The distance between the CB and the stationary mitochondria increases with time because of the growth of the neuronal process. Extended Data Figures 4-1, 4-2, 4-3 support this figure.
