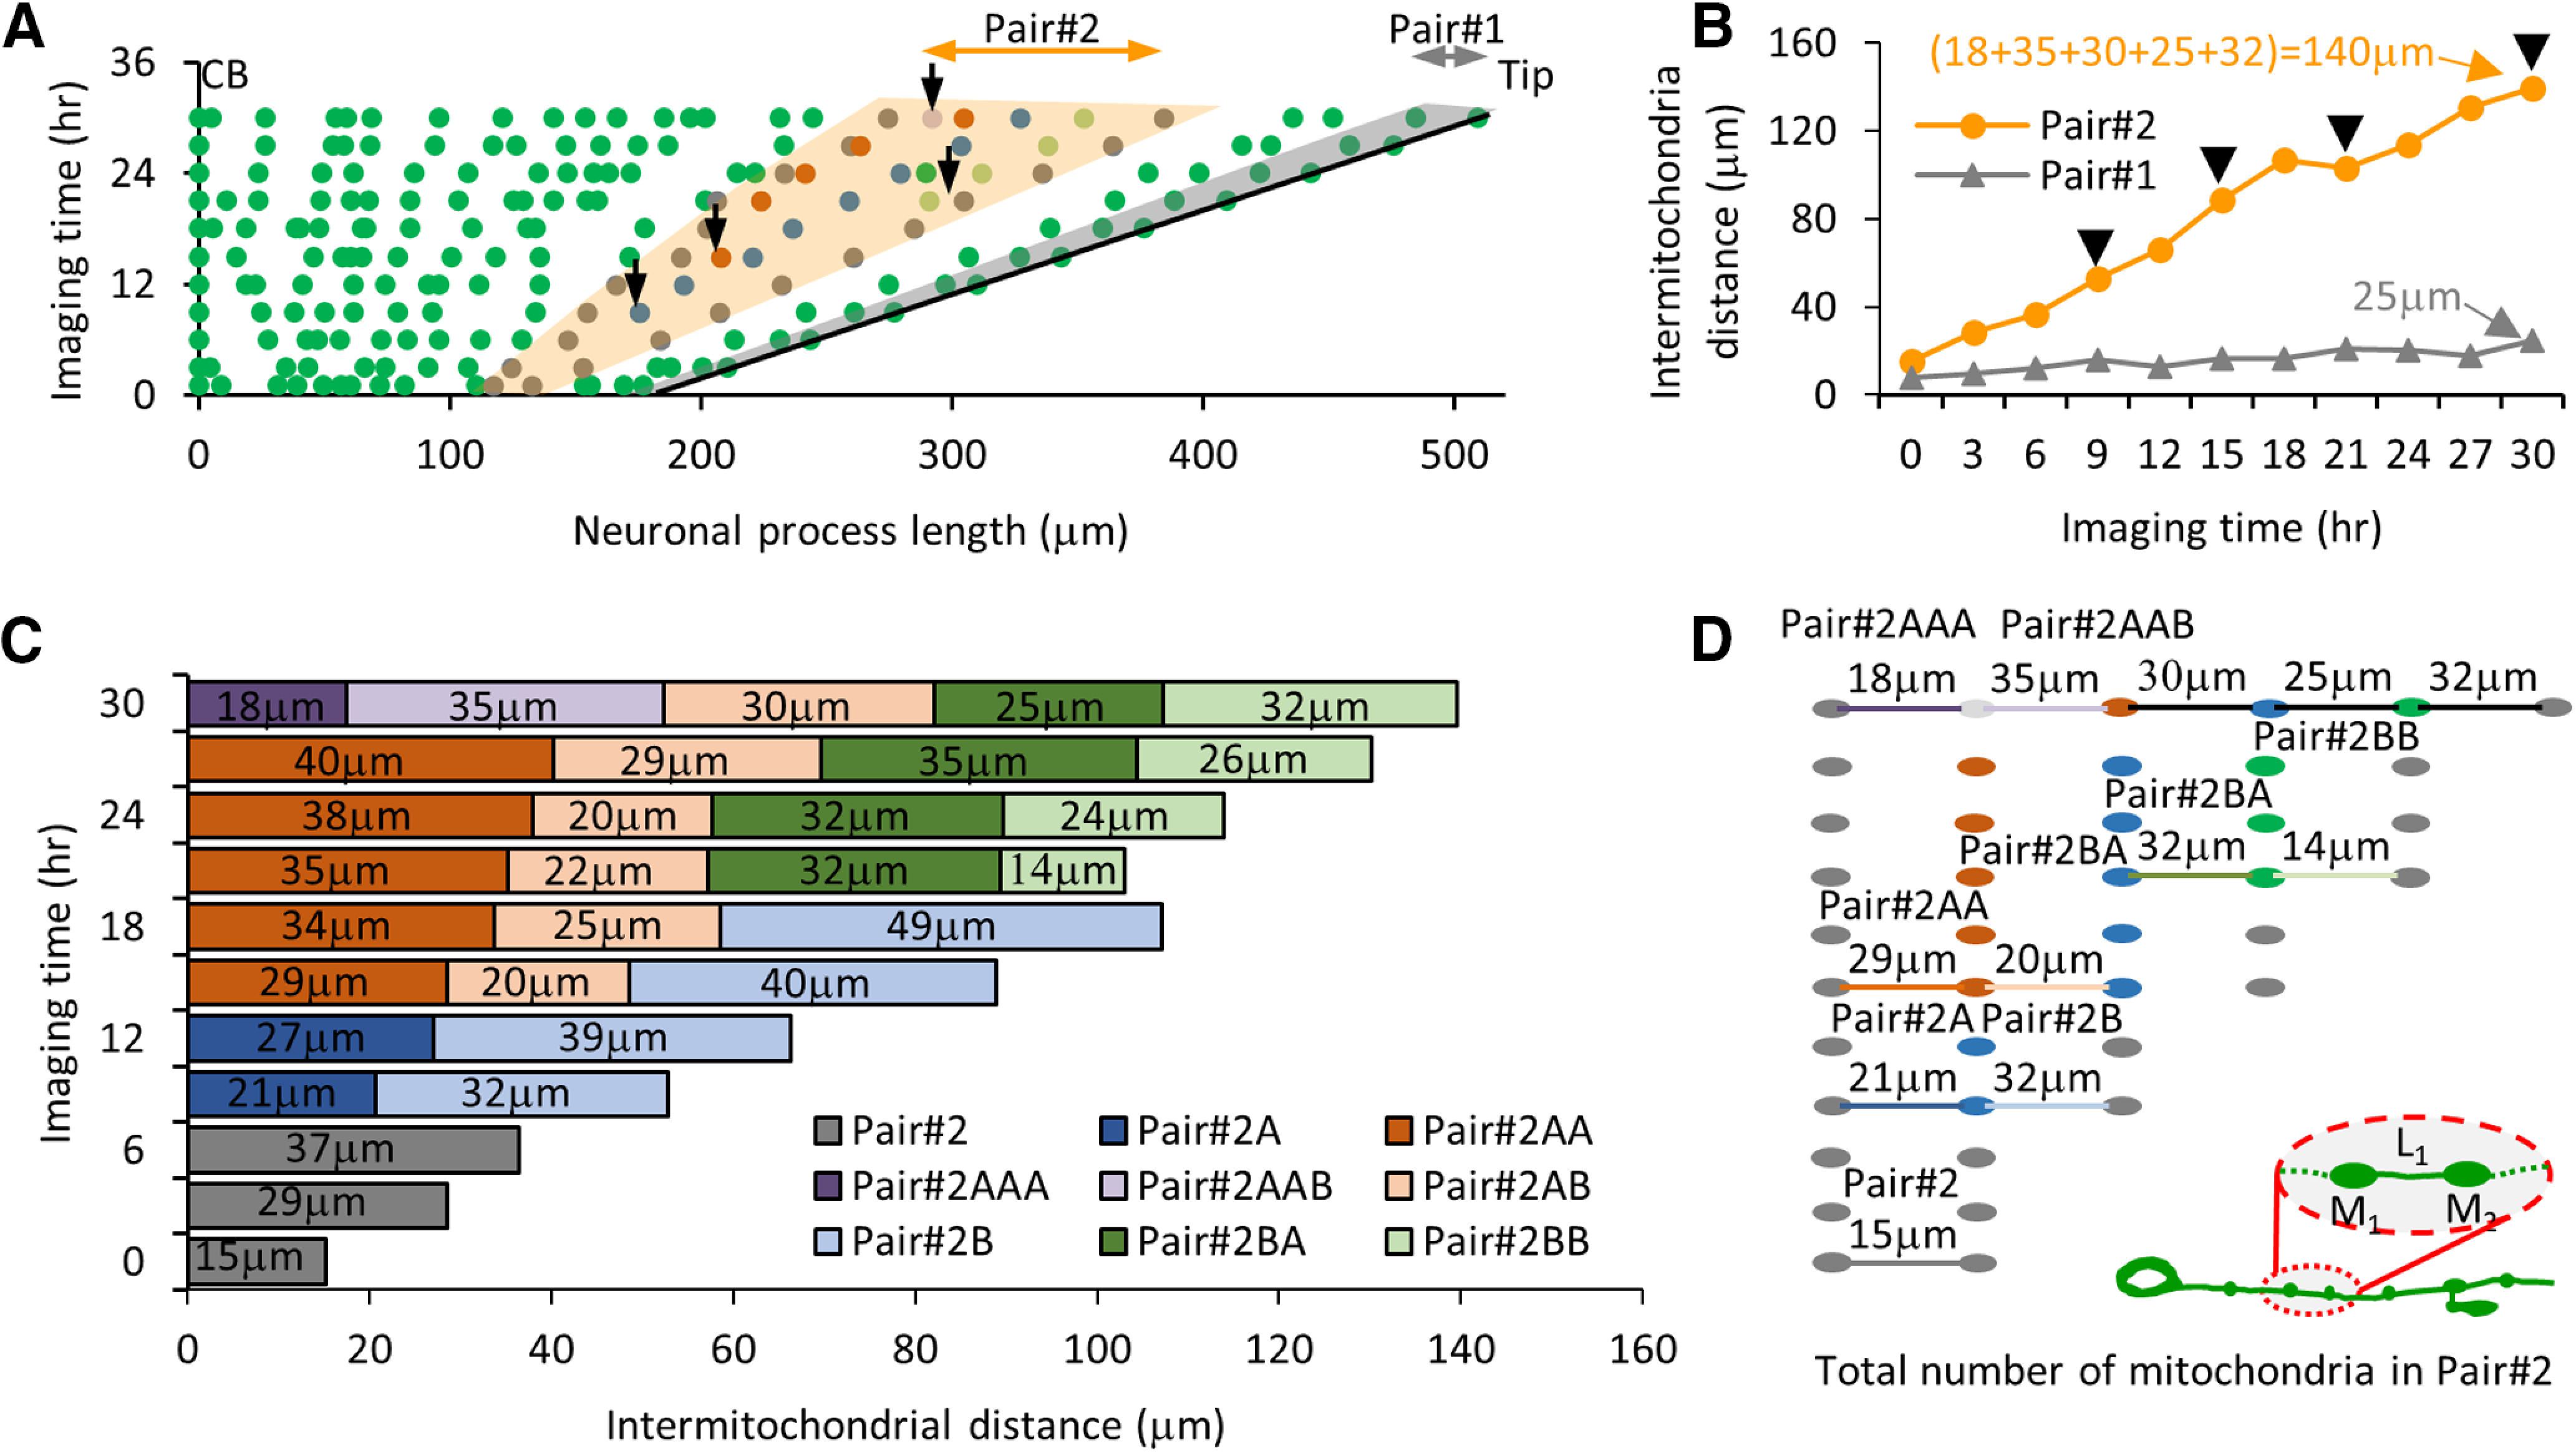
Figure 5.

Addition of new mitochondria during long-time imaging of the animal grown in the microfluidic device. A, Map of mitochondrial position from an individual C. elegans PLM neuron 36 h after hatching. Solid lines represent all two locations CB and Tip of the neuronal process. The shaded area in gray (pair #1) is a region in the neuronal process where no mitochondrion is added between adjacent pairs in 30 h of imaging. The shaded area in orange (pair #2) represents regions of the same neuronal process where four new mitochondria are identified between the adjacent pairs at different imaging times. The black arrows represent locations of all four new mitochondria. B, Intermitochondrial intervals at different imaging times of two different pairs of stationary mitochondria (pairs #1 and #2) from an individual TRN process. The arrows indicate the time points when a new mitochondrion was added between the two adjacent mitochondria along the TRN process. The values indicate the total distance between parent adjacent pairs at the 30th hour of imaging, on adding all the intermediate intermitochondrial intervals formed because of new mitochondria additions. C, The bar represents the intermitochondrial distances for pair #2 measured from time-lapse imaging. Upon addition of a new mitochondrion, each pair of mitochondria is labeled as new and represented by two new colors (light and dark). The numbers on each bar indicate the intermitochondrial distances for every mitochondria pair. The shorter intermitochondrial distances in a few time points arise because of local compression/expansion of the neuronal process and are considered to be artifacts of imaging because of animal posture. D, Schematic of the mitochondria lineage in pair #2. The gray dots on the right represents the original adjacent mitochondria pair (not to the scale), while the new color dot indicates the location of the new mitochondrion added. Whenever a new mitochondrion is added, the intermitochondrial distances between new adjacent pairs are indicated by a line with a color similar to the color of the bars. The inset shows the schematic of a growing PLM neuron during the development of C. elegans. The cell body is on left and the neuronal process end is on right. The inset also shows two mitochondria (M1 and M2) separated by length L1.
